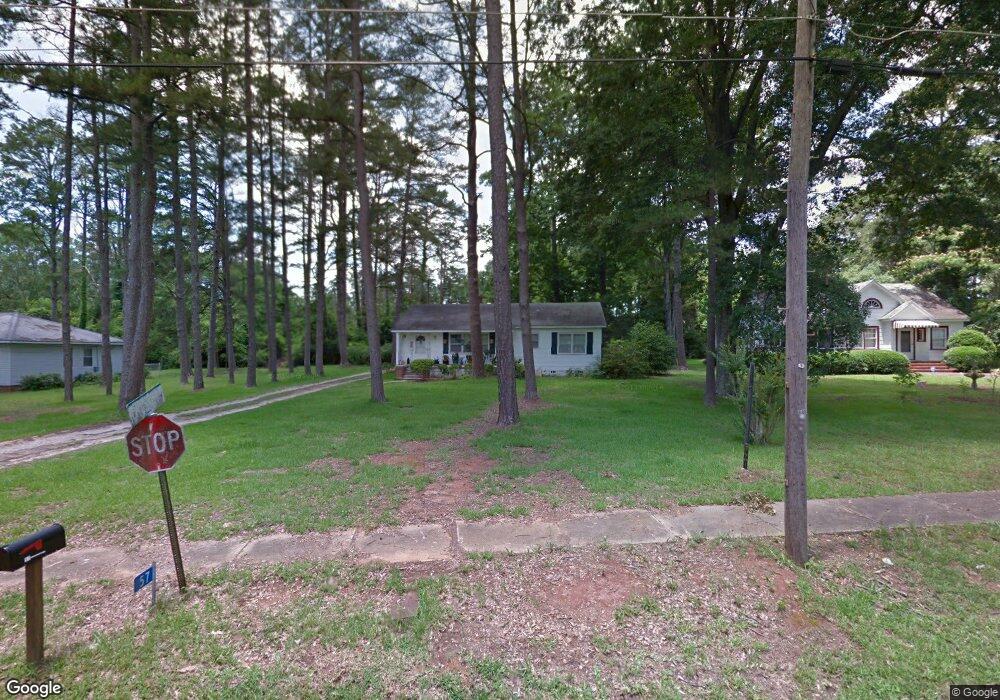
57 Powell St Cuthbert, GA 39840
Estimated Value: $95,400 - $107,000
3
Beds
2
Baths
1,686
Sq Ft
$61/Sq Ft
Est. Value
About This Home
This home is located at 57 Powell St, Cuthbert, GA 39840 and is currently estimated at $102,100, approximately $60 per square foot. 57 Powell St is a home with nearby schools including Randolph County Elementary School, Randolph Clay Middle School, and Randolph Clay High School.
Ownership History
Date
Name
Owned For
Owner Type
Purchase Details
Closed on
Jul 31, 2024
Sold by
Camichael Charlotte Lee
Bought by
Brown Cindy H
Current Estimated Value
Purchase Details
Closed on
Jul 29, 2024
Sold by
Hardwick Vivian S
Bought by
Carmichael Charlotte Lee
Purchase Details
Closed on
Feb 26, 2019
Sold by
Hardwick Charles D
Bought by
Hardwick Vivian S
Purchase Details
Closed on
Nov 18, 2010
Sold by
Ragan Walter R
Bought by
Hardwick Charles D and Hardwick Vivian S
Purchase Details
Closed on
Jun 23, 2009
Sold by
Hardwick Charles D
Bought by
Ragan Walter R
Purchase Details
Closed on
Mar 23, 2007
Sold by
Trussell Henry L
Bought by
Hardwick Charles D and Hardwick Vivian S
Purchase Details
Closed on
Nov 8, 2006
Sold by
Trussell Henry
Bought by
Trussell Henry L
Purchase Details
Closed on
Oct 21, 1991
Bought by
Trussell Emily E
Create a Home Valuation Report for This Property
The Home Valuation Report is an in-depth analysis detailing your home's value as well as a comparison with similar homes in the area
Home Values in the Area
Average Home Value in this Area
Purchase History
| Date | Buyer | Sale Price | Title Company |
|---|---|---|---|
| Brown Cindy H | $95,000 | -- | |
| Carmichael Charlotte Lee | -- | -- | |
| Hardwick Vivian S | -- | -- | |
| Hardwick Vivian S | -- | -- | |
| Hardwick Charles D | -- | -- | |
| Hardwick Charles D | -- | -- | |
| Ragan Walter R | $64,500 | -- | |
| Ragan Walter R | $64,500 | -- | |
| Hardwick Charles D | $45,000 | -- | |
| Hardwick Charles D | $45,000 | -- | |
| Trussell Henry L | -- | -- | |
| Trussell Henry L | -- | -- | |
| Trussell Emily E | -- | -- | |
| Trussell Emily E | -- | -- |
Source: Public Records
Tax History
| Year | Tax Paid | Tax Assessment Tax Assessment Total Assessment is a certain percentage of the fair market value that is determined by local assessors to be the total taxable value of land and additions on the property. | Land | Improvement |
|---|---|---|---|---|
| 2025 | $1,698 | $34,196 | $5,280 | $28,916 |
| 2024 | $1,657 | $30,960 | $4,800 | $26,160 |
| 2023 | $1,449 | $30,960 | $4,800 | $26,160 |
| 2022 | $1,132 | $30,960 | $4,800 | $26,160 |
| 2021 | $712 | $19,135 | $3,683 | $15,452 |
| 2020 | $732 | $19,135 | $3,683 | $15,452 |
| 2019 | $728 | $19,135 | $3,683 | $15,452 |
| 2018 | $881 | $19,135 | $3,683 | $15,452 |
| 2017 | $697 | $19,135 | $3,683 | $15,452 |
| 2016 | $698 | $19,135 | $3,683 | $15,452 |
| 2015 | -- | $19,135 | $3,683 | $15,452 |
| 2014 | -- | $18,022 | $2,864 | $15,158 |
| 2013 | -- | $18,022 | $2,864 | $15,158 |
Source: Public Records
Map
Nearby Homes
- 365 Highland Ave
- 42 W Harris St
- 140 College St
- 396 Hood St
- 298 Nelson Coffin Dr
- Mattox Rd
- 0 District Line Rd Unit 10518137
- Old Spring Rd
- Cotton Hill Rd
- 0 Benevolence Hwy Unit 26314983
- Pierce Rd
- 3833 US Highway 82
- 21 Acres Oak Grove Rd
- 0 County Rd 70
- 886 Mound Rd
- 135 Eleven Bridges Rd
- 3437 Us Highway 82
- 3833
- XX2 Us-27
- XX1 US 27
- 71 Powell St
- 43 Powell St
- 87 Powell St
- 70 Powell St
- 10 Kingston St
- 25 Powell St
- 302 Highland Ave
- 294 Highland Ave
- 282 Highland Ave
- 25 Kingston St
- 316 Highland Ave
- 73 Keene St
- 332 Highland Ave
- 270 Highland Ave
- 24 Kingston St
- 85 Keene St
- 342 Highland Ave
- 32 Powell St
- 122 N Highland Ave
- 325 N Highland Ave
Your Personal Tour Guide
Ask me questions while you tour the home.