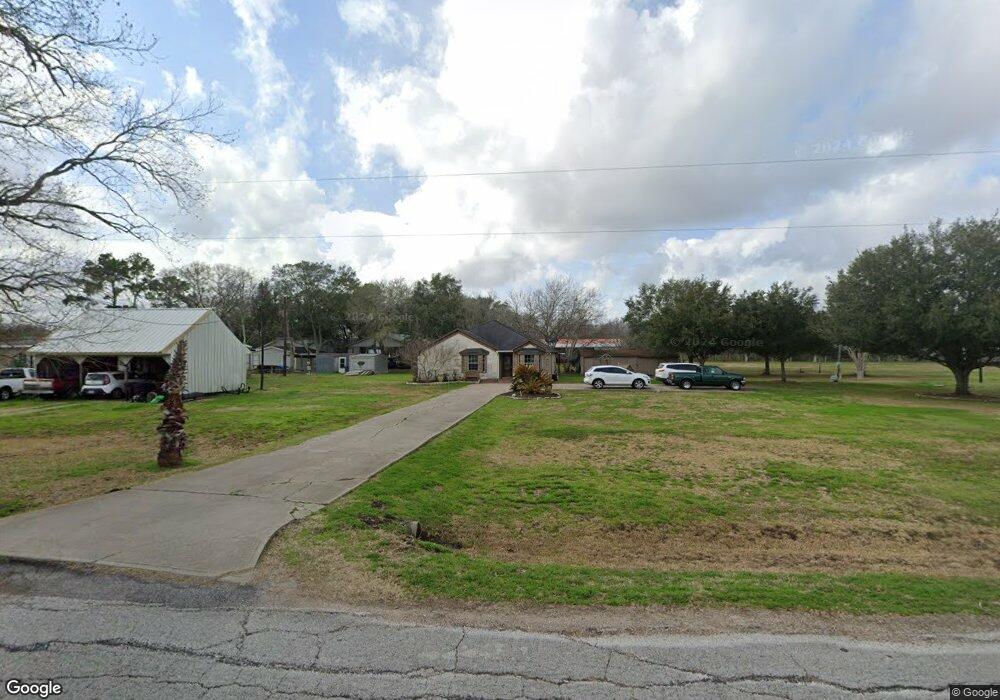
5722 Trinity Dr Richmond, TX 77469
Estimated Value: $288,033 - $338,000
2
Beds
1
Bath
1,760
Sq Ft
$180/Sq Ft
Est. Value
About This Home
This home is located at 5722 Trinity Dr, Richmond, TX 77469 and is currently estimated at $316,008, approximately $179 per square foot. 5722 Trinity Dr is a home with nearby schools including Harry Wright Junior High School.
Ownership History
Date
Name
Owned For
Owner Type
Purchase Details
Closed on
Oct 24, 2020
Sold by
Ortiz Fidel Damian
Bought by
Bejarmano Juan Jose
Current Estimated Value
Purchase Details
Closed on
Aug 16, 2002
Sold by
Lfc Asset Recovery
Bought by
Ortiz Fidel Damain and Juan Jose Bejarano
Purchase Details
Closed on
Aug 9, 2002
Sold by
Lfc Asset Recovery
Bought by
Litchfield Financial Corp
Purchase Details
Closed on
Nov 10, 1997
Sold by
Delgado Victor Matthew
Bought by
Hernandez J Refugio and Hernandez Juanita
Home Financials for this Owner
Home Financials are based on the most recent Mortgage that was taken out on this home.
Original Mortgage
$74,900
Interest Rate
7.28%
Purchase Details
Closed on
Aug 14, 1997
Sold by
Sunflower Homes Inc
Bought by
Krobot Raymond and Krobot Violet
Home Financials for this Owner
Home Financials are based on the most recent Mortgage that was taken out on this home.
Original Mortgage
$21,500
Interest Rate
7.34%
Mortgage Type
Seller Take Back
Create a Home Valuation Report for This Property
The Home Valuation Report is an in-depth analysis detailing your home's value as well as a comparison with similar homes in the area
Purchase History
We collect this data history from publicly available records. To have your information removed, we recommend requesting removal directly through your county’s website.
| Date | Buyer | Sale Price | Title Company |
|---|---|---|---|
| Bejarmano Juan Jose | -- | Montgomery County Title | |
| Bejano Juan Jose | -- | None Available | |
| Ortiz Fidel Damain | -- | -- | |
| Litchfield Financial Corp | -- | Montgomery County Title Co | |
| Hernandez J Refugio | -- | Fort Bend Title Company | |
| Krobot Raymond | -- | Fort Bend Title Company |
Source: Public Records
Mortgage History
We collect this data history from publicly available records. To have your information removed, we recommend requesting removal directly through your county’s website.
| Date | Status | Borrower | Loan Amount |
|---|---|---|---|
| Previous Owner | Hernandez J Refugio | $74,900 | |
| Previous Owner | Krobot Raymond | $21,500 | |
| Closed | Hernandez J Refugio | $6,232 |
Source: Public Records
Tax History
| Year | Tax Paid | Tax Assessment Tax Assessment Total Assessment is a certain percentage of the fair market value that is determined by local assessors to be the total taxable value of land and additions on the property. | Land | Improvement |
|---|---|---|---|---|
| 2025 | $3,107 | $245,800 | $115,000 | $130,800 |
| 2024 | $3,107 | $238,370 | $40,425 | $197,945 |
| 2023 | $2,752 | $216,700 | $0 | $222,510 |
| 2022 | $2,858 | $197,000 | $9,000 | $188,000 |
| 2021 | $3,848 | $214,400 | $9,000 | $205,400 |
| 2020 | $3,657 | $200,690 | $9,000 | $191,690 |
| 2019 | $3,992 | $204,320 | $9,000 | $195,320 |
| 2018 | $3,986 | $203,450 | $9,000 | $194,450 |
| 2017 | $3,178 | $161,830 | $9,000 | $152,830 |
| 2016 | $2,815 | $143,310 | $9,000 | $134,310 |
| 2015 | $2,847 | $144,070 | $9,000 | $135,070 |
| 2014 | $2,538 | $134,640 | $9,000 | $125,640 |
Source: Public Records
Map
Nearby Homes
- 6718 Kari Ln
- 6325 Kamas Ln
- 6018 Pleak Rd
- 6723 Pleak Crossing
- 7115 Kamas Ln
- 00 Saddle Dr
- 000 Saddle Dr
- 6429 Fm 2218 Rd
- 6542 Summer Azure Ln
- 4710 Saddle Dr
- 0 Farm-To-market 2218
- 4819 Little Metalmark Dr
- 4818 Summersweet Ln
- 0 Fm 361 Rd Unit 24089668
- 4826 Summersweet Ln
- 4831 Little Metalmark Dr
- 4830 Summersweet Ln
- 6511 Silver Emperor Ln
- 6515 Silver Emperor Ln
- 4834 Summersweet Ln
Your Personal Tour Guide
Ask me questions while you tour the home.