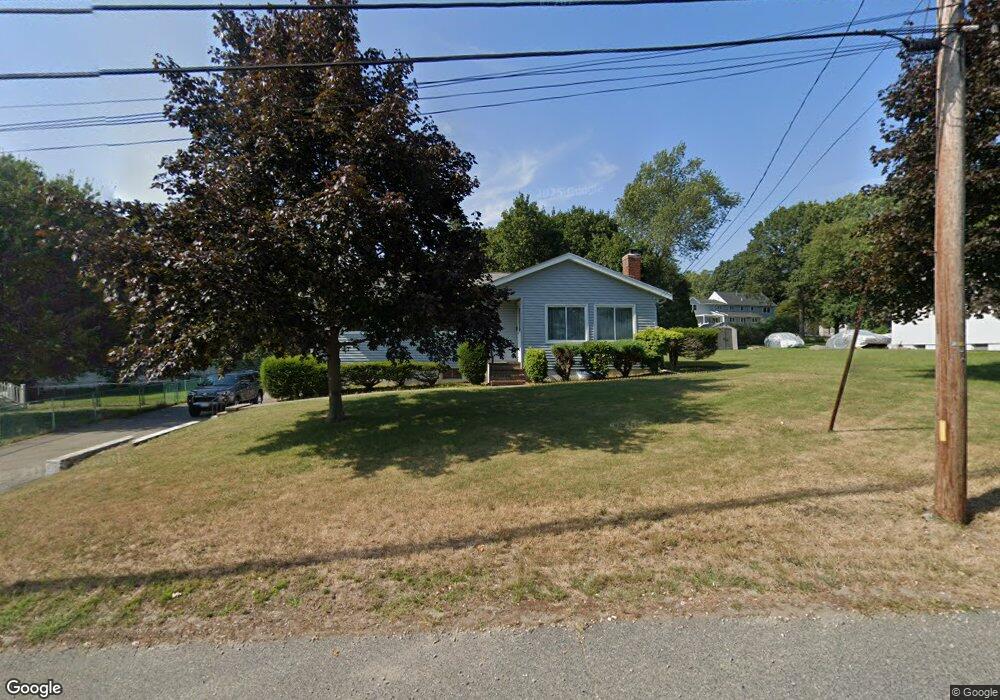
573 West St Braintree, MA 02184
North Braintree NeighborhoodEstimated Value: $617,204 - $742,000
3
Beds
2
Baths
1,120
Sq Ft
$603/Sq Ft
Est. Value
About This Home
This home is located at 573 West St, Braintree, MA 02184 and is currently estimated at $675,801, approximately $603 per square foot. 573 West St is a home located in Norfolk County with nearby schools including Braintree High School, Step Ahead Kindergarten, and Meeting House Montessori School.
Ownership History
Date
Name
Owned For
Owner Type
Purchase Details
Closed on
Feb 28, 2001
Sold by
Marston Charles and Marston Elaine M
Bought by
Lee Eduardo
Current Estimated Value
Home Financials for this Owner
Home Financials are based on the most recent Mortgage that was taken out on this home.
Original Mortgage
$229,500
Outstanding Balance
$76,033
Interest Rate
7%
Mortgage Type
Purchase Money Mortgage
Estimated Equity
$599,768
Create a Home Valuation Report for This Property
The Home Valuation Report is an in-depth analysis detailing your home's value as well as a comparison with similar homes in the area
Home Values in the Area
Average Home Value in this Area
Purchase History
We collect this data history from publicly available records. To have your information removed, we recommend requesting removal directly through your county’s website.
| Date | Buyer | Sale Price | Title Company |
|---|---|---|---|
| Lee Eduardo | $255,000 | -- |
Source: Public Records
Mortgage History
We collect this data history from publicly available records. To have your information removed, we recommend requesting removal directly through your county’s website.
| Date | Status | Borrower | Loan Amount |
|---|---|---|---|
| Open | Lee Eduardo | $229,500 |
Source: Public Records
Tax History
| Year | Tax Paid | Tax Assessment Tax Assessment Total Assessment is a certain percentage of the fair market value that is determined by local assessors to be the total taxable value of land and additions on the property. | Land | Improvement |
|---|---|---|---|---|
| 2025 | $5,405 | $541,600 | $346,500 | $195,100 |
| 2024 | $4,870 | $513,700 | $320,300 | $193,400 |
| 2023 | $4,643 | $475,700 | $294,000 | $181,700 |
| 2022 | $4,524 | $454,700 | $273,000 | $181,700 |
| 2021 | $4,199 | $422,000 | $252,000 | $170,000 |
| 2020 | $3,954 | $401,000 | $231,000 | $170,000 |
| 2019 | $3,847 | $381,300 | $231,000 | $150,300 |
| 2018 | $3,625 | $343,900 | $199,500 | $144,400 |
| 2017 | $3,581 | $333,400 | $189,000 | $144,400 |
| 2016 | $3,392 | $308,900 | $168,000 | $140,900 |
| 2015 | $3,303 | $298,400 | $157,500 | $140,900 |
| 2014 | $3,122 | $273,400 | $151,200 | $122,200 |
Source: Public Records
Map
Nearby Homes
- 137 Eleanor Dr
- 31 Brierwood Rd
- 801 Granite St
- 399 Pond St Unit B8
- 399 Pond St Unit D1
- 11 Royal Lake Dr Unit 6
- 80 Hollingsworth Ave
- 78 Windemere Cir
- 241 Walnut St
- 98 West St
- 4 Lake St
- 65 Lake St
- 24 Brow Ave
- 55 Hobart Ave
- 18 Howie Rd
- 491 Washington St Unit 1
- 6 Franklin St
- 11 Hingston Cir
- 111 Barstow Dr
- 5 Woodsum Dr Unit 5
Your Personal Tour Guide
Ask me questions while you tour the home.