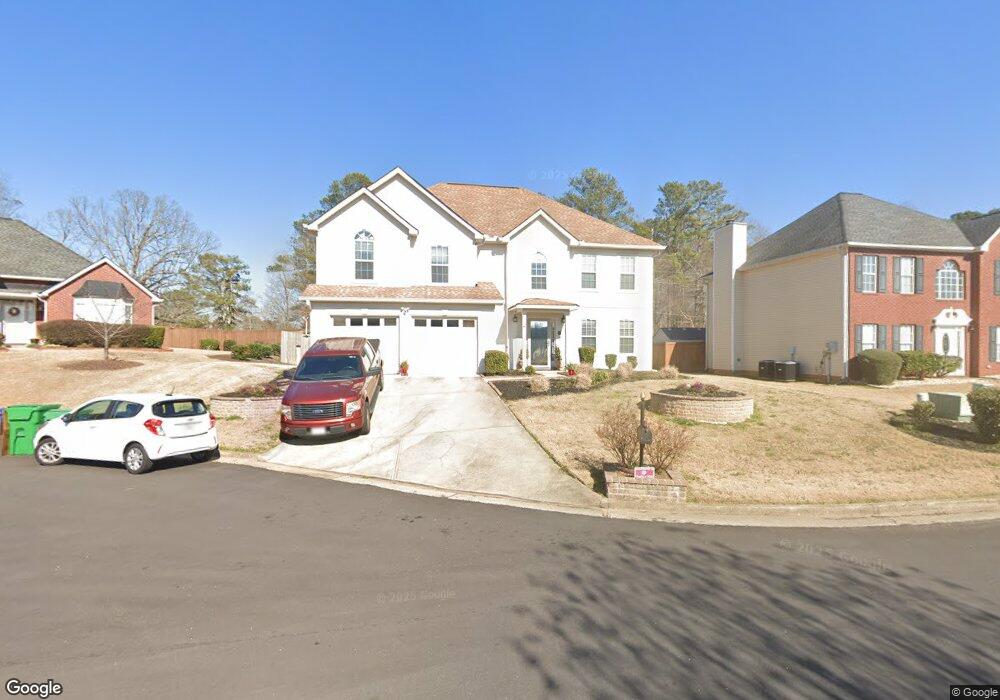
5738 Spring Mill Cir Lithonia, GA 30038
Estimated Value: $283,554 - $361,000
3
Beds
3
Baths
2,709
Sq Ft
$115/Sq Ft
Est. Value
About This Home
This home is located at 5738 Spring Mill Cir, Lithonia, GA 30038 and is currently estimated at $312,389, approximately $115 per square foot. 5738 Spring Mill Cir is a home located in DeKalb County with nearby schools including Flat Rock Elementary School, Salem Middle School, and Martin Luther King- Jr. High School.
Ownership History
Date
Name
Owned For
Owner Type
Purchase Details
Closed on
Jun 5, 2006
Sold by
Asset-Backed Securities Corp H
Bought by
Maxwell Roger E
Current Estimated Value
Home Financials for this Owner
Home Financials are based on the most recent Mortgage that was taken out on this home.
Original Mortgage
$124,000
Interest Rate
9.75%
Mortgage Type
Stand Alone Second
Purchase Details
Closed on
Apr 4, 2006
Sold by
Kingsberry Deborah L
Bought by
Asset-Backed Securities Corp H
Purchase Details
Closed on
Sep 19, 2001
Sold by
Kingsberry Roland M
Bought by
Kingsberry Deborah L
Purchase Details
Closed on
Jul 18, 1997
Sold by
Greenwood Homes Inc
Bought by
Kingsbery Roland and Kingsbery Deborah
Home Financials for this Owner
Home Financials are based on the most recent Mortgage that was taken out on this home.
Original Mortgage
$126,176
Interest Rate
7.59%
Mortgage Type
FHA
Create a Home Valuation Report for This Property
The Home Valuation Report is an in-depth analysis detailing your home's value as well as a comparison with similar homes in the area
Home Values in the Area
Average Home Value in this Area
Purchase History
We collect this data history from publicly available records. To have your information removed, we recommend requesting removal directly through your county’s website.
| Date | Buyer | Sale Price | Title Company |
|---|---|---|---|
| Maxwell Roger E | -- | -- | |
| Marshall Roger E | $155,000 | -- | |
| Asset-Backed Securities Corp H | $169,116 | -- | |
| Kingsberry Deborah L | -- | -- | |
| Kingsbery Roland | $129,900 | -- |
Source: Public Records
Mortgage History
We collect this data history from publicly available records. To have your information removed, we recommend requesting removal directly through your county’s website.
| Date | Status | Borrower | Loan Amount |
|---|---|---|---|
| Previous Owner | Marshall Roger E | $124,000 | |
| Previous Owner | Kingsbery Roland | $126,176 |
Source: Public Records
Tax History
| Year | Tax Paid | Tax Assessment Tax Assessment Total Assessment is a certain percentage of the fair market value that is determined by local assessors to be the total taxable value of land and additions on the property. | Land | Improvement |
|---|---|---|---|---|
| 2025 | $3,411 | $117,240 | $15,200 | $102,040 |
| 2024 | $3,559 | $120,200 | $5,240 | $114,960 |
| 2023 | $3,559 | $116,400 | $5,240 | $111,160 |
| 2022 | $3,216 | $109,560 | $5,240 | $104,320 |
| 2021 | $2,649 | $83,440 | $5,240 | $78,200 |
| 2020 | $2,349 | $71,560 | $5,240 | $66,320 |
| 2019 | $2,364 | $71,120 | $5,240 | $65,880 |
| 2018 | $1,869 | $64,640 | $5,240 | $59,400 |
| 2017 | $2,039 | $59,000 | $5,240 | $53,760 |
| 2016 | $1,849 | $54,920 | $5,240 | $49,680 |
| 2014 | $894 | $27,160 | $5,240 | $21,920 |
Source: Public Records
Map
Nearby Homes
- 5453 Flat Rock Point
- 5744 Salem Rd
- 5757 Fieldstone Dr
- 5681 Winchester Place
- 5660 Fox Hound Trail
- 4046 Crossvale Rd
- 3871 Thornbury Ct
- 5487 Walnut Ln
- 5806 Windermere Ct
- 3767 Walnut Creek Way
- 5507 Walnut Ln
- 5502 Walnut Ln
- 3492 Luna Trail
- 5624 Browns Mill Rd
- 5928 Springs Way
- 5933 Springs Way
- 5938 Springs Way
- 5948 Springs Way
- 5975 Springs Way
- 5440 Browns Mill
- 5758 Spring Mill Cir
- 5764 Spring Mill Cir
- 5375 Flat Rock Point Unit LOT 10
- 5369 Flat Rock Point
- 5357 Flat Rock Point
- 5350 Flat Rock Point
- 5459 Flat Rock Point
- 5744 Spring Mill Cir
- 5770 Spring Mill Cir
- 5737 Mill View Way
- 5763 Spring Mill Cir
- 5776 Spring Mill Cir
- 5736 Mill View Way
- 5769 Spring Mill Cir
- 5727 Mill View Way
- 5735 Spring Mill Cir
- 5777 Spring Mill Cir
- 5782 Spring Mill Cir
- 5726 Mill View Way
- 5713 Mill View Way
Your Personal Tour Guide
Ask me questions while you tour the home.