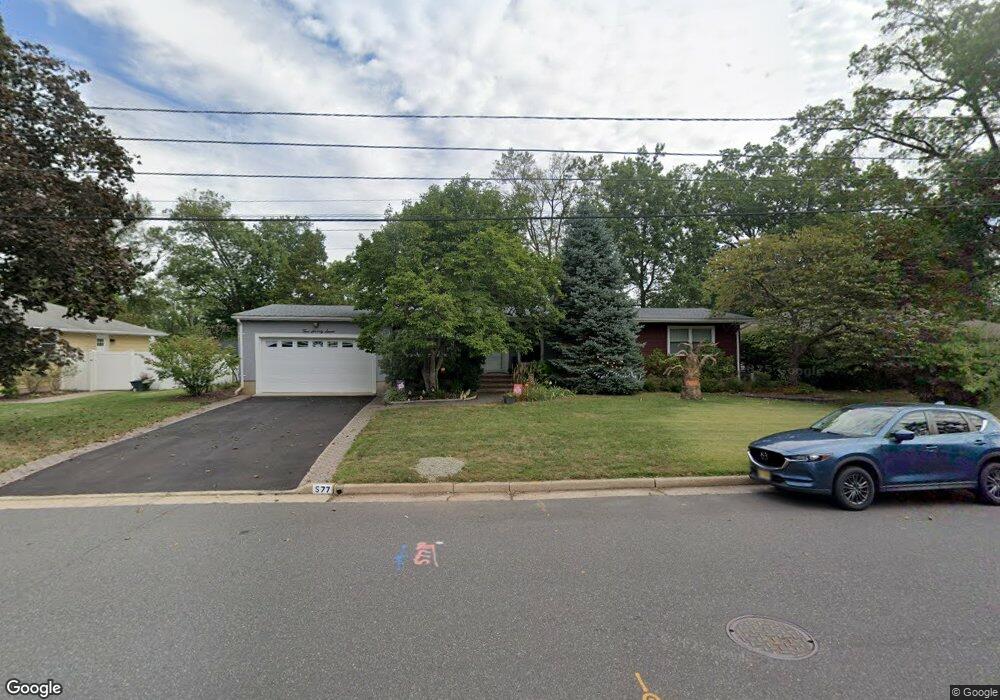
577 Ashland Rd Middlesex, NJ 08846
Estimated Value: $591,306 - $620,000
Studio
--
Bath
1,832
Sq Ft
$330/Sq Ft
Est. Value
About This Home
This home is located at 577 Ashland Rd, Middlesex, NJ 08846 and is currently estimated at $604,827, approximately $330 per square foot. 577 Ashland Rd is a home located in Middlesex County with nearby schools including Middlesex High School and Our Lady of Mount Virgin School.
Ownership History
Date
Name
Owned For
Owner Type
Purchase Details
Closed on
Aug 23, 2010
Sold by
Smith Elizabeth
Bought by
The Elizabeth Smith Irrevocable Family T
Current Estimated Value
Purchase Details
Closed on
Jul 1, 2002
Sold by
Watson John
Home Financials for this Owner
Home Financials are based on the most recent Mortgage that was taken out on this home.
Original Mortgage
$271,700
Interest Rate
6.73%
Create a Home Valuation Report for This Property
The Home Valuation Report is an in-depth analysis detailing your home's value as well as a comparison with similar homes in the area
Home Values in the Area
Average Home Value in this Area
Purchase History
| Date | Buyer | Sale Price | Title Company |
|---|---|---|---|
| The Elizabeth Smith Irrevocable Family T | -- | None Available | |
| -- | $286,000 | -- |
Source: Public Records
Mortgage History
| Date | Status | Borrower | Loan Amount |
|---|---|---|---|
| Previous Owner | -- | $271,700 |
Source: Public Records
Tax History
| Year | Tax Paid | Tax Assessment Tax Assessment Total Assessment is a certain percentage of the fair market value that is determined by local assessors to be the total taxable value of land and additions on the property. | Land | Improvement |
|---|---|---|---|---|
| 2025 | $11,399 | $551,200 | $164,600 | $386,600 |
| 2024 | $10,852 | $492,600 | $164,600 | $328,000 |
| 2023 | $10,852 | $492,600 | $164,600 | $328,000 |
| 2022 | $13,402 | $135,500 | $41,500 | $94,000 |
| 2021 | $9,679 | $135,500 | $41,500 | $94,000 |
| 2020 | $12,767 | $135,500 | $41,500 | $94,000 |
| 2019 | $12,421 | $135,500 | $41,500 | $94,000 |
| 2018 | $12,045 | $135,500 | $41,500 | $94,000 |
| 2017 | $11,713 | $135,500 | $41,500 | $94,000 |
| 2016 | $11,326 | $135,500 | $41,500 | $94,000 |
| 2015 | $11,087 | $135,500 | $41,500 | $94,000 |
| 2014 | $10,875 | $135,500 | $41,500 | $94,000 |
Source: Public Records
Map
Nearby Homes
- 531 Chestnut St
- 230 Melrose Ave
- 311 Chestnut St
- 116 Greene Ave
- 216 Chestnut St
- 128 Hazelwood Ave
- 110 Benart Place
- 134 Benart Place
- 151 Beechwood Ave
- 101 Lorraine Ave
- 310 Howard Ave
- 212 Vesper Ave
- 315 East St
- 214 Vesper Ave
- 112 East St
- 408 E Union Ave
- 531 Harris Ave
- 105 Swing Bridge Ln Unit 1009
- 8 Swing Bridge Ln Unit 904
- 50 Canal St
Your Personal Tour Guide
Ask me questions while you tour the home.