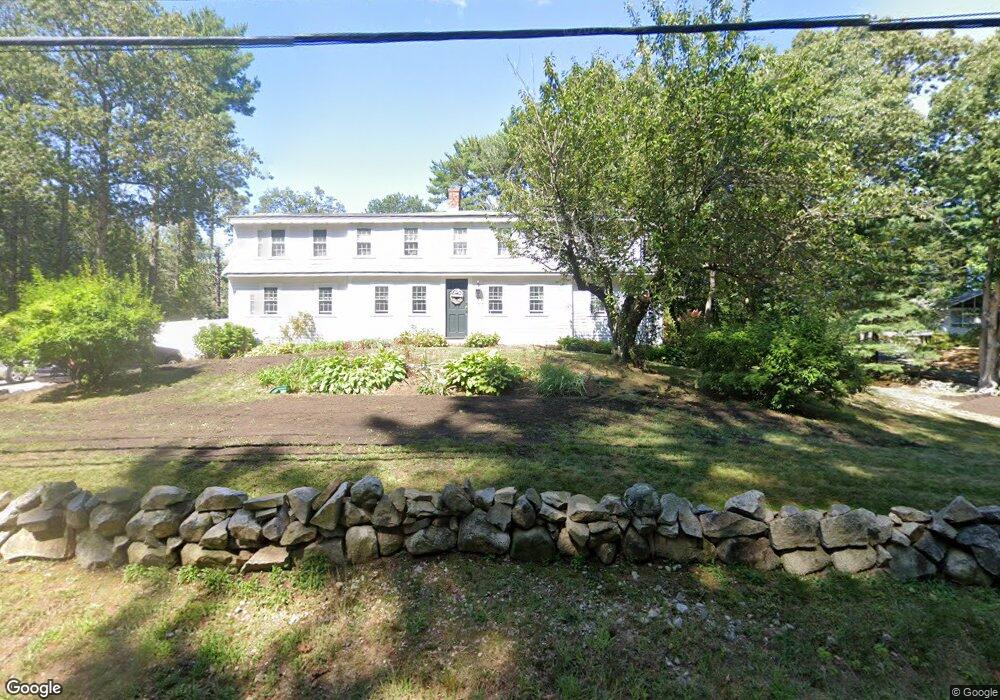
577 Grove St Norwell, MA 02061
Estimated Value: $786,000 - $992,000
3
Beds
2
Baths
2,334
Sq Ft
$371/Sq Ft
Est. Value
About This Home
This home is located at 577 Grove St, Norwell, MA 02061 and is currently estimated at $866,134, approximately $371 per square foot. 577 Grove St is a home located in Plymouth County with nearby schools including Grace Farrar Cole Elementary School, Norwell Middle School, and Norwell High School.
Ownership History
Date
Name
Owned For
Owner Type
Purchase Details
Closed on
Sep 21, 1992
Sold by
Nee Peter F
Bought by
Griffin Daniel and Griffin Melanie
Current Estimated Value
Home Financials for this Owner
Home Financials are based on the most recent Mortgage that was taken out on this home.
Original Mortgage
$124,000
Interest Rate
8.04%
Mortgage Type
Purchase Money Mortgage
Create a Home Valuation Report for This Property
The Home Valuation Report is an in-depth analysis detailing your home's value as well as a comparison with similar homes in the area
Home Values in the Area
Average Home Value in this Area
Purchase History
| Date | Buyer | Sale Price | Title Company |
|---|---|---|---|
| Griffin Daniel | $155,000 | -- |
Source: Public Records
Mortgage History
| Date | Status | Borrower | Loan Amount |
|---|---|---|---|
| Open | Griffin Daniel | $20,000 | |
| Open | Griffin Daniel | $164,500 | |
| Closed | Griffin Daniel | $122,000 | |
| Closed | Griffin Daniel | $124,000 |
Source: Public Records
Tax History
| Year | Tax Paid | Tax Assessment Tax Assessment Total Assessment is a certain percentage of the fair market value that is determined by local assessors to be the total taxable value of land and additions on the property. | Land | Improvement |
|---|---|---|---|---|
| 2025 | $9,443 | $722,500 | $355,900 | $366,600 |
| 2024 | $9,500 | $705,800 | $354,500 | $351,300 |
| 2023 | $9,417 | $615,900 | $315,600 | $300,300 |
| 2022 | $8,631 | $519,300 | $249,500 | $269,800 |
| 2021 | $6,988 | $486,800 | $262,600 | $224,200 |
| 2020 | $8,100 | $487,100 | $262,600 | $224,500 |
| 2019 | $10,463 | $521,200 | $257,300 | $263,900 |
| 2018 | $8,961 | $498,600 | $262,600 | $236,000 |
| 2017 | $8,939 | $453,600 | $262,600 | $191,000 |
| 2016 | $7,484 | $453,600 | $262,600 | $191,000 |
| 2015 | $7,481 | $453,400 | $262,600 | $190,800 |
| 2014 | $6,915 | $422,400 | $248,100 | $174,300 |
Source: Public Records
Map
Nearby Homes
- 35 Hawthorne Ln
- 0 Mount Blue St
- Lot 24 Webster Farm Way
- Lot 1 Webster Farm Way
- Lot 4 Webster Farm Way
- Lot 22 Webster Farm Way
- Lot 26 Webster Farm Way
- 251 Prospect St
- 67 Mount Hope St
- 27 Henrys Ln
- 21 Henrys Ln
- 166 Norwell Ave
- 342 Summer St
- 451 Main St
- 16 Prouty Ave
- 43 Summer St
- 165 R Summer St
- 9 Mast Hill Rd
- 74 Central St
- 49 Washington Park Dr
Your Personal Tour Guide
Ask me questions while you tour the home.