577 Grove St Norwell, MA 02061
Estimated Value: $832,000 - $957,000
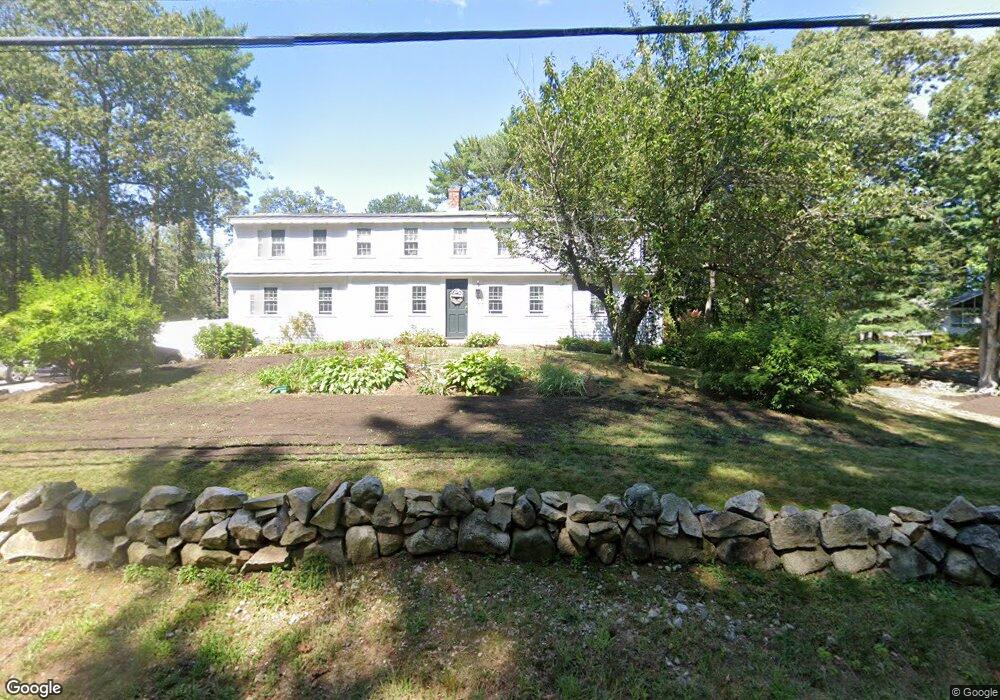
About This Home
This home is located at 577 Grove St, Norwell, MA 02061 and is currently estimated at $891,559, approximately $381 per square foot. 577 Grove St is a home located in Plymouth County with nearby schools including Grace Farrar Cole Elementary School, Norwell Middle School, and Norwell High School.
Ownership History
We collect this data history from publicly available records. To have your information removed, we recommend requesting removal directly through your county’s website.
Purchase Details
Home Financials for this Owner
Home Financials are based on the most recent Mortgage that was taken out on this home.Home Values in the Area
Average Home Value in this Area
Purchase History
We collect this data history from publicly available records. To have your information removed, we recommend requesting removal directly through your county’s website.
| Date | Buyer | Sale Price | Title Company |
|---|---|---|---|
| $155,000 | -- |
Mortgage History
We collect this data history from publicly available records. To have your information removed, we recommend requesting removal directly through your county’s website.
| Date | Status | Borrower | Loan Amount |
|---|---|---|---|
| Open | $20,000 | ||
| Open | $164,500 | ||
| Closed | $122,000 | ||
| Closed | $124,000 |
Tax History
We collect this data history from publicly available records. To have your information removed, we recommend requesting removal directly through your county’s website.
| Year | Tax Paid | Tax Assessment Tax Assessment Total Assessment is a certain percentage of the fair market value that is determined by local assessors to be the total taxable value of land and additions on the property. | Land | Improvement |
|---|---|---|---|---|
| 2025 | $9,443 | $722,500 | $355,900 | $366,600 |
| 2024 | $9,500 | $705,800 | $354,500 | $351,300 |
| 2023 | $9,417 | $615,900 | $315,600 | $300,300 |
| 2022 | $8,631 | $519,300 | $249,500 | $269,800 |
| 2021 | $6,988 | $486,800 | $262,600 | $224,200 |
| 2020 | $8,100 | $487,100 | $262,600 | $224,500 |
| 2019 | $10,463 | $521,200 | $257,300 | $263,900 |
| 2018 | $8,961 | $498,600 | $262,600 | $236,000 |
| 2017 | $8,939 | $453,600 | $262,600 | $191,000 |
| 2016 | $7,484 | $453,600 | $262,600 | $191,000 |
| 2015 | $7,481 | $453,400 | $262,600 | $190,800 |
| 2014 | $6,915 | $422,400 | $248,100 | $174,300 |
Map
- 341 Lincoln St
- 446 Grove St
- 270 Lincoln St
- 179 Lincoln St
- 251 Prospect St
- 17 Woods Rd
- 12 Walnut Rd
- 150 Lincoln St
- 15 Hemlock Dr
- 52 Highland Crossing Rd
- 451 Main St
- 15 Leigh Rd
- 9 Douglas Ave
- 7 Judith St
- 47 Old Oaken Bucket Rd
- 7 Assinippi Ave Unit 214
- 430 Main St
- 205 Pleasant St
- 59 First Parish Rd
- 215 Prospect St
Ask me questions while you tour the home.