579 South St Dalton, MA 01226
Estimated Value: $446,000 - $634,000
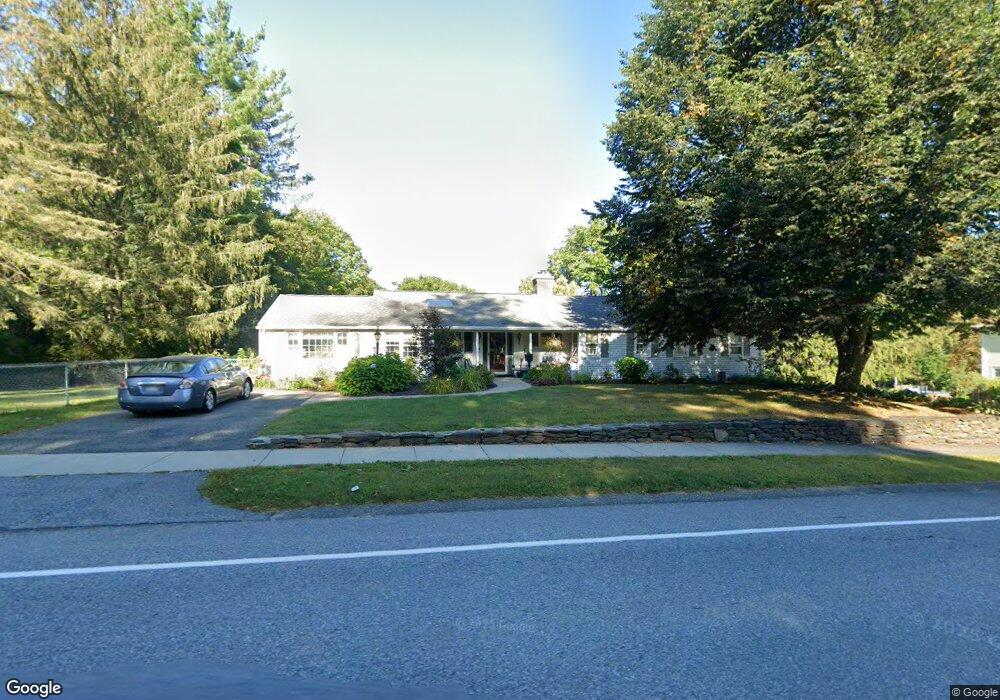
About This Home
This home is located at 579 South St, Dalton, MA 01226 and is currently estimated at $508,647, approximately $195 per square foot. 579 South St is a home located in Berkshire County with nearby schools including Wahconah Regional High School, St. Agnes Academy, and Branches School of the Berkshires.
Ownership History
We collect this data history from publicly available records. To have your information removed, we recommend requesting removal directly through your county’s website.
Purchase Details
Purchase Details
Home Values in the Area
Average Home Value in this Area
Purchase History
We collect this data history from publicly available records. To have your information removed, we recommend requesting removal directly through your county’s website.
| Date | Buyer | Sale Price | Title Company |
|---|---|---|---|
| -- | -- | ||
| $161,000 | -- | ||
| $161,000 | -- |
Mortgage History
We collect this data history from publicly available records. To have your information removed, we recommend requesting removal directly through your county’s website.
| Date | Status | Borrower | Loan Amount |
|---|---|---|---|
| Previous Owner | $141,912 | ||
| Previous Owner | $25,000 |
Tax History
We collect this data history from publicly available records. To have your information removed, we recommend requesting removal directly through your county’s website.
| Year | Tax Paid | Tax Assessment Tax Assessment Total Assessment is a certain percentage of the fair market value that is determined by local assessors to be the total taxable value of land and additions on the property. | Land | Improvement |
|---|---|---|---|---|
| 2025 | $7,611 | $419,800 | $64,000 | $355,800 |
| 2024 | $7,251 | $398,400 | $57,900 | $340,500 |
| 2023 | $5,957 | $342,000 | $52,800 | $289,200 |
| 2022 | $5,957 | $287,200 | $52,800 | $234,400 |
| 2021 | $5,177 | $240,700 | $48,900 | $191,800 |
| 2020 | $4,679 | $230,600 | $48,900 | $181,700 |
| 2019 | $4,899 | $251,500 | $49,600 | $201,900 |
| 2018 | $4,854 | $243,800 | $49,600 | $194,200 |
| 2017 | $4,844 | $243,800 | $49,600 | $194,200 |
| 2016 | $4,786 | $243,800 | $49,600 | $194,200 |
| 2015 | $4,649 | $238,800 | $49,600 | $189,200 |
Map
- 69 Elmore Dr
- 97 Elmore Dr
- @Lot-16- Unit 118-16-0
- 0 Crane Ave
- 127 Pinecrest Dr
- 29 Norwich Dr
- 1 Pondview Dr Unit C3
- 18 Elaine Ave
- 1 and 5 Park Ave
- 1952 East St
- 969 Dalton Ave
- 18 Greenings Ave
- 17 Ashuelot St
- 97 Morningview Dr
- 44 Stockbridge Ave
- 169 Park Ave
- 28 Hopewell Dr
- 94 1st St
- 77 Imperial Ave
- 15 Williamsburg Terrace
Ask me questions while you tour the home.