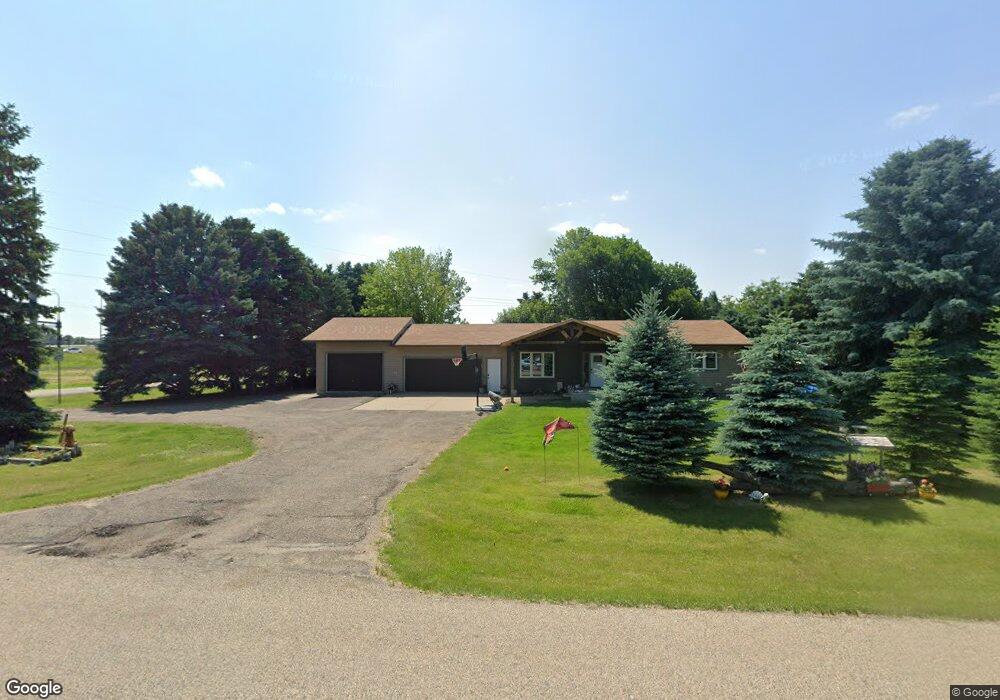
58 Captain Marsh Dr Mandan, ND 58554
Estimated Value: $459,331 - $536,000
5
Beds
2
Baths
2,398
Sq Ft
$207/Sq Ft
Est. Value
About This Home
This home is located at 58 Captain Marsh Dr, Mandan, ND 58554 and is currently estimated at $496,583, approximately $207 per square foot. 58 Captain Marsh Dr is a home located in Morton County with nearby schools including Lewis & Clark Elementary School, Mandan Middle School, and Mandan High School.
Ownership History
Date
Name
Owned For
Owner Type
Purchase Details
Closed on
Nov 13, 2009
Sold by
Dahl Curtiss A
Bought by
Reinholt Jamie L
Current Estimated Value
Home Financials for this Owner
Home Financials are based on the most recent Mortgage that was taken out on this home.
Original Mortgage
$159,100
Outstanding Balance
$101,063
Interest Rate
4.95%
Mortgage Type
New Conventional
Estimated Equity
$395,520
Create a Home Valuation Report for This Property
The Home Valuation Report is an in-depth analysis detailing your home's value as well as a comparison with similar homes in the area
Home Values in the Area
Average Home Value in this Area
Purchase History
| Date | Buyer | Sale Price | Title Company |
|---|---|---|---|
| Reinholt Jamie L | $198,900 | Mandan Guaranty And Title Co |
Source: Public Records
Mortgage History
| Date | Status | Borrower | Loan Amount |
|---|---|---|---|
| Open | Reinholt Jamie L | $159,100 |
Source: Public Records
Tax History
| Year | Tax Paid | Tax Assessment Tax Assessment Total Assessment is a certain percentage of the fair market value that is determined by local assessors to be the total taxable value of land and additions on the property. | Land | Improvement |
|---|---|---|---|---|
| 2025 | $1,789 | $188,950 | $17,700 | $171,250 |
| 2024 | $38 | $178,000 | $0 | $0 |
| 2023 | $3,657 | $175,400 | $17,700 | $157,700 |
| 2022 | $3,081 | $147,900 | $17,600 | $130,300 |
| 2021 | $2,805 | $133,850 | $19,150 | $114,700 |
| 2020 | $2,679 | $134,150 | $19,150 | $115,000 |
| 2019 | $2,707 | $131,700 | $0 | $0 |
| 2018 | $2,598 | $131,450 | $19,150 | $112,300 |
| 2017 | $2,558 | $130,450 | $19,150 | $111,300 |
| 2016 | $2,366 | $123,150 | $19,150 | $104,000 |
| 2015 | $2,231 | $116,800 | $19,150 | $97,650 |
| 2014 | $2,055 | $111,350 | $20,100 | $91,250 |
| 2013 | $1,977 | $102,850 | $19,150 | $83,700 |
Source: Public Records
Map
Nearby Homes
- 2109 Bridgeview Ct SE
- 2207 Bridgeview Ct
- 2313 Pirates Loop SE
- 4500 Sundancer Loop SE Unit 2
- 2120 Sundancer Loop SE Unit 5
- 2445 Waterpark Loop SE
- 2454 Waterpark Loop SE
- 1005 W Highland Acres Rd
- 2617 Verity Ln SE
- 2616 Douglas Place SE
- 2601 Douglas Place SE
- 2625 Douglas Place SE
- 1120 Keating Dr
- 3714 Amity Cir SE
- 4004 Bayport Place SE
- 3834 Gale Cir SE
- 3801 Gale Cir SE
- 4103 Bayport Place SE
- 3410 Heartwood Place
- 3305 Bay Shore Bend SE
- 48 Captain Marsh Dr
- 47 Captain Marsh Dr
- 46 Captain Marsh Dr
- 55 Captain Marsh Dr
- 45 Captain Marsh Dr
- 44 Captain Marsh Dr
- 0 Captain Marsh Dr
- 54 Captain Marsh Dr
- 43 Captain Marsh Dr
- 62 Captain Leach Dr
- 53 Captain Marsh Dr
- 2005 Pirate''S Loop SE
- 42 Captain Marsh Dr
- 52 Captain Marsh Dr
- 1999 Pirates Loop SE
- 2004 Marina Rd SE
- 2001 Pirates Loop SE
- 41 Captain Marsh Dr
- 2003 Marina Rd SE
- 1990 Pirates Loop SE
Your Personal Tour Guide
Ask me questions while you tour the home.