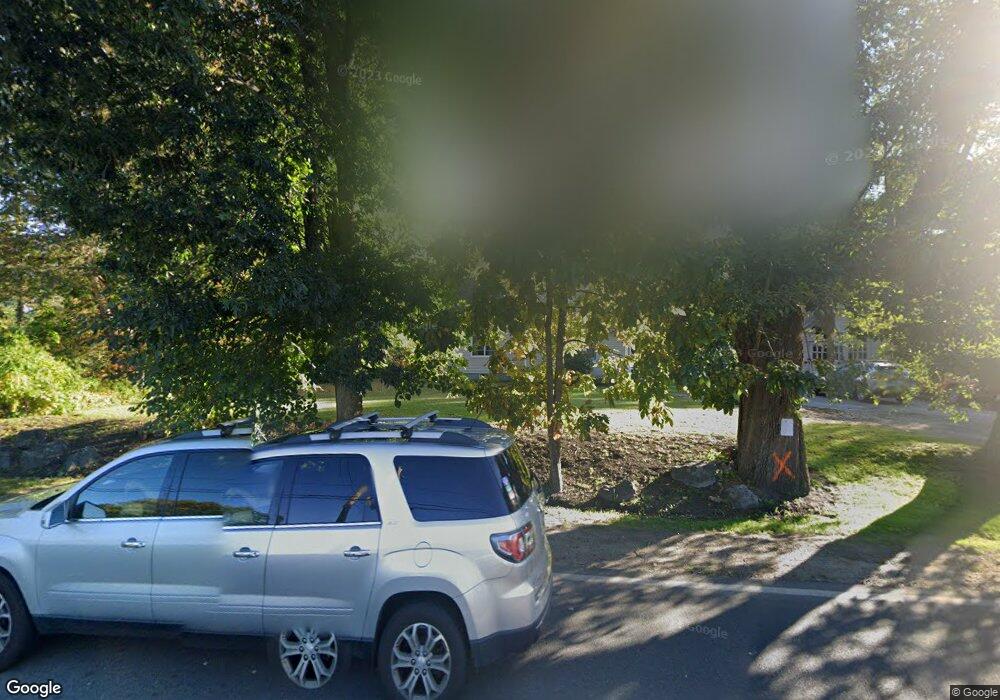
58 Central St Byfield, MA 01922
Estimated Value: $738,046 - $780,000
3
Beds
2
Baths
1,903
Sq Ft
$402/Sq Ft
Est. Value
About This Home
This home is located at 58 Central St, Byfield, MA 01922 and is currently estimated at $764,512, approximately $401 per square foot. 58 Central St is a home located in Essex County with nearby schools including Triton Regional High School, North Shore Montessori School, and The Governors Academy.
Ownership History
Date
Name
Owned For
Owner Type
Purchase Details
Closed on
Dec 2, 1991
Sold by
Atwell David W and Atwell Donna J
Bought by
Bennett Kevin P and Shea Patricia
Current Estimated Value
Create a Home Valuation Report for This Property
The Home Valuation Report is an in-depth analysis detailing your home's value as well as a comparison with similar homes in the area
Home Values in the Area
Average Home Value in this Area
Purchase History
We collect this data history from publicly available records. To have your information removed, we recommend requesting removal directly through your county’s website.
| Date | Buyer | Sale Price | Title Company |
|---|---|---|---|
| Bennett Kevin P | $152,000 | -- | |
| Bennett Kevin P | $152,000 | -- |
Source: Public Records
Mortgage History
We collect this data history from publicly available records. To have your information removed, we recommend requesting removal directly through your county’s website.
| Date | Status | Borrower | Loan Amount |
|---|---|---|---|
| Open | Bennett Kevin P | $46,000 | |
| Closed | Bennett Kevin P | $15,000 | |
| Open | Bennett Kevin P | $163,000 |
Source: Public Records
Tax History
| Year | Tax Paid | Tax Assessment Tax Assessment Total Assessment is a certain percentage of the fair market value that is determined by local assessors to be the total taxable value of land and additions on the property. | Land | Improvement |
|---|---|---|---|---|
| 2025 | $4,896 | $657,200 | $326,500 | $330,700 |
| 2024 | $4,942 | $643,500 | $326,500 | $317,000 |
| 2023 | $5,097 | $587,900 | $298,100 | $289,800 |
| 2022 | $4,943 | $508,000 | $254,600 | $253,400 |
| 2021 | $4,800 | $450,300 | $211,000 | $239,300 |
| 2020 | $4,869 | $443,000 | $211,000 | $232,000 |
| 2019 | $4,789 | $443,000 | $211,000 | $232,000 |
| 2018 | $4,512 | $413,900 | $200,100 | $213,800 |
| 2017 | $4,334 | $408,500 | $200,100 | $208,400 |
| 2016 | $3,897 | $341,800 | $167,500 | $174,300 |
| 2015 | $3,897 | $338,300 | $167,500 | $170,800 |
| 2014 | $3,706 | $327,400 | $156,600 | $170,800 |
Source: Public Records
Map
Nearby Homes
- 34 Central St Unit 34 Lincoln
- 34 Central St Unit 44 Kennedy
- 34 Central St Unit 31 Washing
- 34 Central St Unit 4 Madison
- 34 Central St Unit 1
- 11 Cricket Ln Unit 11-Dogwood
- 13 Cricket Ln Unit 13-DOGWOOD
- 55 Pearson Dr Unit 3 - ALDER
- 66 Parish Rd Unit 8
- 66 Parish Rd Unit 4
- 10 Lenway Rd
- 167 Elm St
- 21 Main St
- 60 Caldwell Farm Rd
- 87 Elm St
- 21 Greentree Ln
- 6 Courtney Dr
- 13 Spring Hill Rd
- 29 Orchard St
- 2 Tiger Row
Your Personal Tour Guide
Ask me questions while you tour the home.