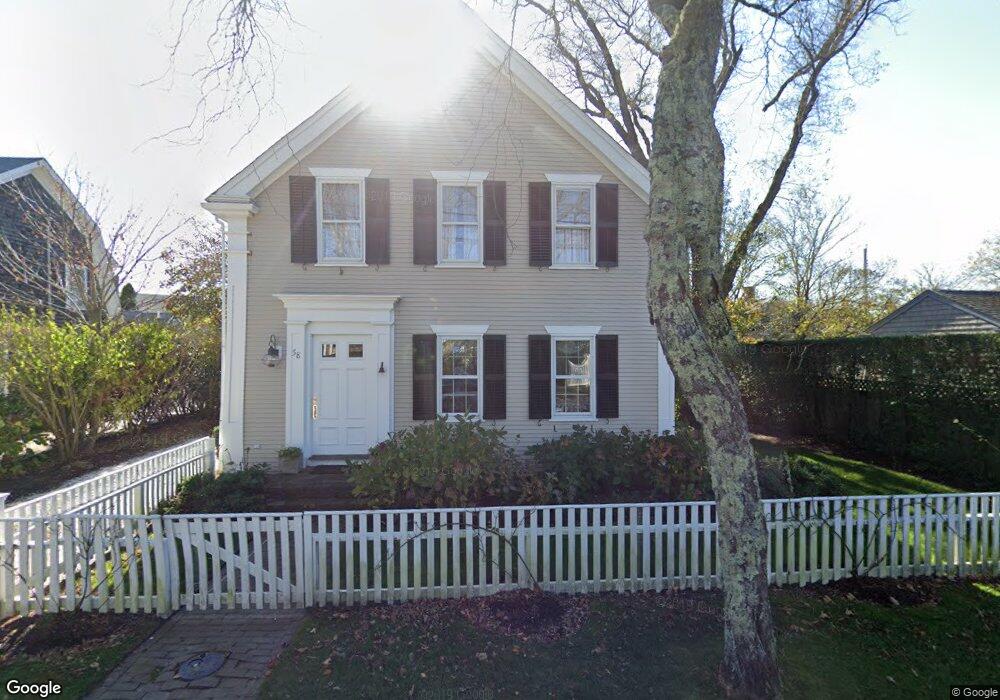
58 Cliff Rd Nantucket, MA 02554
Estimated Value: $4,498,350 - $7,211,000
4
Beds
4
Baths
2,247
Sq Ft
$2,426/Sq Ft
Est. Value
About This Home
This home is located at 58 Cliff Rd, Nantucket, MA 02554 and is currently estimated at $5,451,838, approximately $2,426 per square foot. 58 Cliff Rd is a home located in Nantucket County with nearby schools including Nantucket Elementary School, Cyrus Peirce Middle School, and Nantucket High School.
Ownership History
Date
Name
Owned For
Owner Type
Purchase Details
Closed on
Apr 2, 2014
Sold by
Barnes Sarah E
Bought by
Jensen Barnes Lt and Jensen
Current Estimated Value
Purchase Details
Closed on
Jul 17, 1997
Sold by
Longmeadow Rt and Glidden Richard J
Bought by
Barnes Sarah E
Home Financials for this Owner
Home Financials are based on the most recent Mortgage that was taken out on this home.
Original Mortgage
$627,500
Interest Rate
7.79%
Mortgage Type
Purchase Money Mortgage
Create a Home Valuation Report for This Property
The Home Valuation Report is an in-depth analysis detailing your home's value as well as a comparison with similar homes in the area
Home Values in the Area
Average Home Value in this Area
Purchase History
| Date | Buyer | Sale Price | Title Company |
|---|---|---|---|
| Jensen Barnes Lt | -- | -- | |
| Jensen Barnes Lt | -- | -- | |
| Jensen Barnes Lt | -- | -- | |
| Barnes Sarah E | $927,500 | -- | |
| Barnes Sarah E | $927,500 | -- |
Source: Public Records
Mortgage History
| Date | Status | Borrower | Loan Amount |
|---|---|---|---|
| Previous Owner | Barnes Sarah E | $627,500 | |
| Previous Owner | Barnes Sarah E | $370,000 | |
| Previous Owner | Barnes Sarah E | $225,000 |
Source: Public Records
Tax History
| Year | Tax Paid | Tax Assessment Tax Assessment Total Assessment is a certain percentage of the fair market value that is determined by local assessors to be the total taxable value of land and additions on the property. | Land | Improvement |
|---|---|---|---|---|
| 2025 | $12,850 | $3,917,800 | $2,180,300 | $1,737,500 |
| 2024 | $12,313 | $3,933,800 | $2,220,700 | $1,713,100 |
| 2023 | $10,878 | $3,388,700 | $2,114,800 | $1,273,900 |
| 2022 | $10,759 | $2,876,800 | $1,923,000 | $953,800 |
| 2021 | $9,047 | $2,492,200 | $1,538,400 | $953,800 |
| 2020 | $9,210 | $2,669,600 | $1,666,600 | $1,003,000 |
| 2019 | $8,965 | $2,668,300 | $1,665,300 | $1,003,000 |
| 2018 | $8,846 | $2,506,000 | $1,601,300 | $904,700 |
| 2017 | $8,259 | $2,436,400 | $1,556,400 | $880,000 |
| 2016 | $7,976 | $2,373,800 | $1,537,200 | $836,600 |
| 2015 | $6,999 | $1,938,800 | $1,243,100 | $695,700 |
| 2014 | $7,290 | $1,938,800 | $1,243,100 | $695,700 |
Source: Public Records
Map
Nearby Homes
Your Personal Tour Guide
Ask me questions while you tour the home.