5808 W Clay St Sioux Falls, SD 57106
Northwest Sioux Falls NeighborhoodEstimated Value: $253,000 - $297,000
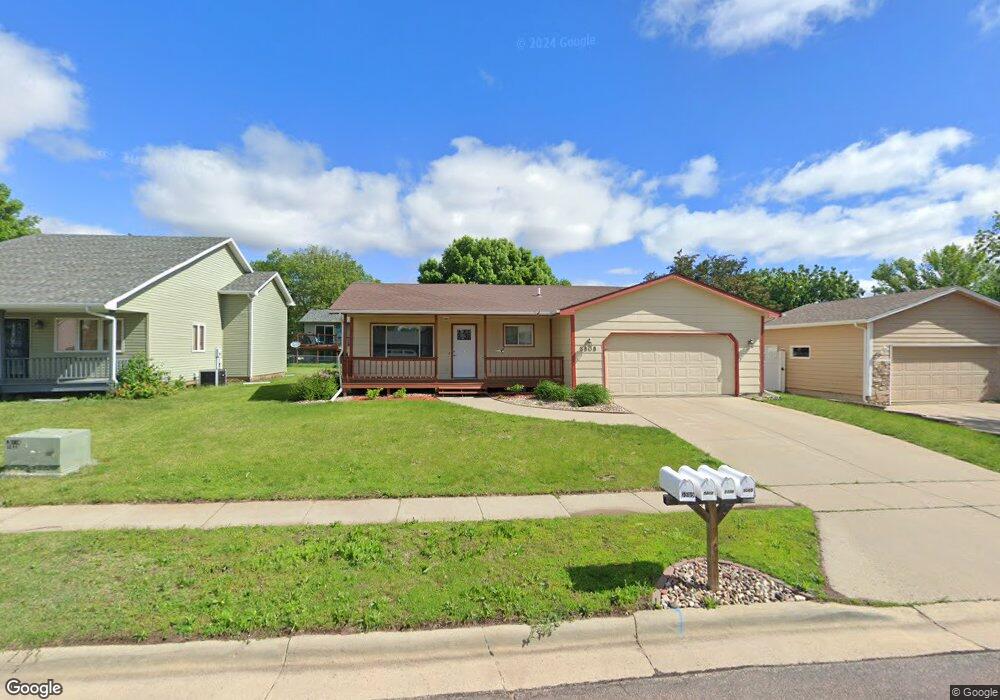
About This Home
Welcome to the Beautiful 3 Bed 2 Bath House in West Sioux Falls, a gem in the heart of South Dakota. This home boasts three spacious bedrooms and two full bathrooms, providing ample space for comfortable living.
The house is equipped with air conditioning, a dishwasher, refrigerator, microwave, and an oven, all of which are new appliances, ensuring a modern and efficient living experience. The house also features updated flooring, adding a touch of elegance to the overall aesthetic. For your convenience, a washer and dryer are included, making laundry days a breeze. The electric heat ensures a warm and cozy environment during the colder months.
Step outside onto the deck and enjoy the fresh air, or simply use this outdoor space for entertaining. In case of any unexpected issues, 24/7 emergency maintenance is available, providing peace of mind and prompt assistance. This house is not just a place to live, but a place to call home.
Pets considered with additional pet fee & pet rent. Eligible for $0 security deposit.
*Rent rates and availability are subject to change. Images, 3D tours, and renderings of units may be similar to available units and do not necessarily represent the specific units available. For more information, contact Real Property Management Express*
Professionally leased and managed by Real Property Management Express
24/7 Emergency Maintenance
Electric Heat
New Appliances
No Utilities Included
Oven
Updated Flooring
Washer/Dryer
Home Values in the Area
Average Home Value in this Area
Property History
| Date | Event | Price | List to Sale | Price per Sq Ft |
|---|---|---|---|---|
| 12/01/2025 12/01/25 | Off Market | $1,699 | -- | -- |
| 11/06/2025 11/06/25 | For Rent | $1,699 | -- | -- |
Tax History
| Year | Tax Paid | Tax Assessment Tax Assessment Total Assessment is a certain percentage of the fair market value that is determined by local assessors to be the total taxable value of land and additions on the property. | Land | Improvement |
|---|---|---|---|---|
| 2024 | $4,024 | $239,600 | $21,000 | $218,600 |
| 2023 | $4,024 | $228,000 | $21,000 | $207,000 |
| 2022 | $2,898 | $191,900 | $21,000 | $170,900 |
| 2021 | $2,420 | $163,200 | $0 | $0 |
| 2020 | $2,420 | $152,900 | $0 | $0 |
| 2019 | $2,426 | $150,762 | $0 | $0 |
| 2018 | $2,205 | $142,499 | $0 | $0 |
| 2017 | $2,015 | $137,334 | $23,715 | $113,619 |
| 2016 | $2,015 | $125,116 | $23,715 | $101,401 |
| 2015 | $2,016 | $120,422 | $23,715 | $96,707 |
| 2014 | -- | $124,733 | $24,054 | $100,679 |
Map
- 6108 W Golden Place
- 1000 S Bridgeport Place
- 5615 W Dardanella Rd
- 5501 W Clay St
- 1117 S Bridgeport Place
- 1117 S Newport Place
- 6305 W Westview Rd
- 1244 S Stoney Pointe Ct
- 5005 W Alpha Place
- 1605 S Silver Creek Cir
- 6317 W Pine Meadows Place
- 5809 W Wren Place
- 5913 W 27th St
- 1402 S Ebenezer Ave
- 809 S Outlook Dr
- 7209 W Stoney Creek St
- 6103 W Chickadee Place
- 5513 W Chelsea Dr
- 4501 W Graceland Place
- 6500 W 6th Place
- 5812 W Clay St
- 5804 W Clay St
- 5816 W Clay St
- 5813 W Missouri St
- 5809 W Missouri St
- 5800 W Clay St
- 5805 W Missouri St
- 5817 W Missouri St
- 5809 W Clay St
- 5805 W Clay St
- 5817 W Clay St
- 5801 W Missouri St
- 5716 W Clay St
- 5801 W Clay St
- 5821 W Clay St
- 5717 W Clay St
- 5717 W Missouri St
- 5712 W Clay St
- 5808 W Missouri St
- 5804 W Missouri St
Ask me questions while you tour the home.