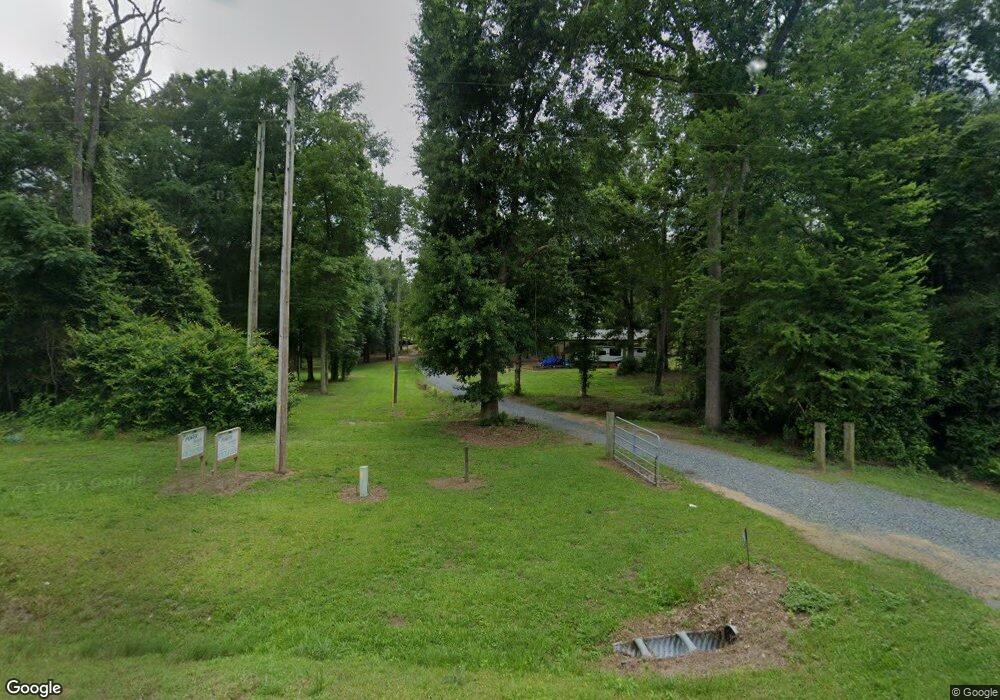
581 Macon Rd Reynolds, GA 31076
Estimated Value: $175,000 - $269,000
3
Beds
3
Baths
1,496
Sq Ft
$143/Sq Ft
Est. Value
About This Home
This home is located at 581 Macon Rd, Reynolds, GA 31076 and is currently estimated at $213,706, approximately $142 per square foot. 581 Macon Rd is a home with nearby schools including Taylor County Upper Elementary School, Taylor County Primary School, and Taylor County Middle School.
Ownership History
Date
Name
Owned For
Owner Type
Purchase Details
Closed on
Dec 19, 2006
Sold by
Nelson Margaret V
Bought by
Nipper Heather and Nipper Kevin
Current Estimated Value
Create a Home Valuation Report for This Property
The Home Valuation Report is an in-depth analysis detailing your home's value as well as a comparison with similar homes in the area
Purchase History
| Date | Buyer | Sale Price | Title Company |
|---|---|---|---|
| Nipper Heather | -- | -- |
Source: Public Records
Tax History
| Year | Tax Paid | Tax Assessment Tax Assessment Total Assessment is a certain percentage of the fair market value that is determined by local assessors to be the total taxable value of land and additions on the property. | Land | Improvement |
|---|---|---|---|---|
| 2025 | $1,326 | $65,140 | $9,600 | $55,540 |
| 2024 | $1,443 | $70,268 | $9,600 | $60,668 |
| 2023 | $1,250 | $57,788 | $9,600 | $48,188 |
| 2022 | $1,270 | $55,308 | $9,600 | $45,708 |
| 2021 | $1,184 | $52,308 | $9,600 | $42,708 |
| 2020 | $1,116 | $49,040 | $9,600 | $39,440 |
| 2019 | $1,134 | $49,040 | $9,600 | $39,440 |
| 2018 | $1,181 | $49,040 | $9,600 | $39,440 |
| 2017 | $1,094 | $48,005 | $9,600 | $38,405 |
| 2016 | $1,087 | $48,005 | $9,600 | $38,405 |
| 2015 | -- | $48,005 | $9,600 | $38,405 |
| 2014 | -- | $49,139 | $9,000 | $40,139 |
| 2013 | -- | $52,366 | $9,600 | $42,766 |
Source: Public Records
Map
Nearby Homes
- 612 Macon Rd
- 0 Suggs Mill Pond Rd Unit 26113830
- 25 W Marion St
- 9 Friar Tuck Rd
- 160 Underwood Rd
- 210 Flint River Estates Rd
- 60 Booker Montgomery Rd
- 1235 Tommy Purvis Rd
- 1446 Avera Rd
- 2304 Cummings Rd
- 1800 Cummings Rd
- Cummings Rd
- 3875 Ga Highway 128
- 1092 Tommy Purvis Rd
- 296 Boxwood Rd
- 296 Boxwood (3061 Acres) Rd
- 1441 Zenith Mill Rd
- 3875 Georgia 128
- 26 Mount Olive Church Rd
- 0 Wainwright Rd Unit 27012350
Your Personal Tour Guide
Ask me questions while you tour the home.