585 Blackrock Rd Coventry, RI 02816
Estimated Value: $414,000 - $499,000
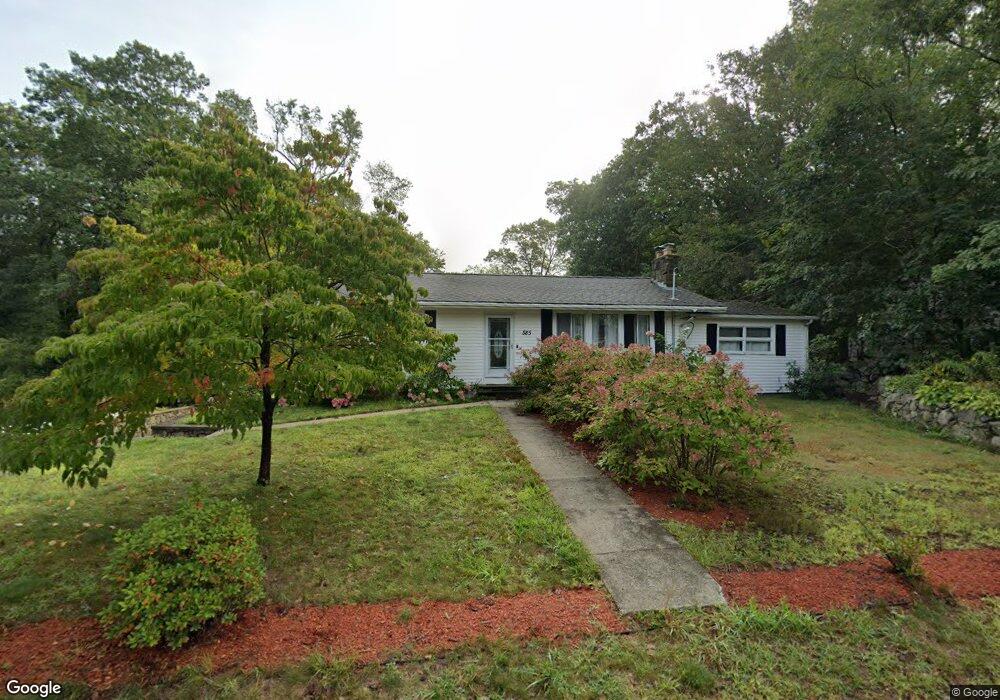
About This Home
This home is located at 585 Blackrock Rd, Coventry, RI 02816 and is currently estimated at $449,835, approximately $334 per square foot. 585 Blackrock Rd is a home located in Kent County with nearby schools including Alan Shawn Feinstein Ms Of Cov, Coventry High School, and St Joseph School.
Ownership History
We collect this data history from publicly available records. To have your information removed, we recommend requesting removal directly through your county’s website.
Purchase Details
Purchase Details
Purchase Details
Purchase Details
Purchase History
We collect this data history from publicly available records. To have your information removed, we recommend requesting removal directly through your county’s website.
| Date | Buyer | Sale Price | Title Company |
|---|---|---|---|
| $154,900 | -- | ||
| $198,000 | -- | ||
| $280,000 | -- | ||
| $110,500 | -- |
Mortgage History
We collect this data history from publicly available records. To have your information removed, we recommend requesting removal directly through your county’s website.
| Date | Status | Borrower | Loan Amount |
|---|---|---|---|
| Open | $34,600 | ||
| Open | $148,344 |
Tax History
We collect this data history from publicly available records. To have your information removed, we recommend requesting removal directly through your county’s website.
| Year | Tax Paid | Tax Assessment Tax Assessment Total Assessment is a certain percentage of the fair market value that is determined by local assessors to be the total taxable value of land and additions on the property. | Land | Improvement |
|---|---|---|---|---|
| 2025 | $5,195 | $322,900 | $122,800 | $200,100 |
| 2024 | $5,115 | $322,900 | $122,800 | $200,100 |
| 2023 | $4,950 | $322,900 | $122,800 | $200,100 |
| 2022 | $4,869 | $248,800 | $117,100 | $131,700 |
| 2021 | $4,827 | $248,800 | $117,100 | $131,700 |
| 2020 | $5,533 | $248,800 | $117,100 | $131,700 |
| 2019 | $4,326 | $194,500 | $82,100 | $112,400 |
| 2018 | $4,203 | $194,500 | $82,100 | $112,400 |
| 2017 | $4,081 | $194,500 | $82,100 | $112,400 |
| 2016 | $4,924 | $230,000 | $128,300 | $101,700 |
| 2015 | $4,791 | $230,000 | $128,300 | $101,700 |
| 2014 | $4,691 | $230,000 | $128,300 | $101,700 |
| 2013 | $4,592 | $246,100 | $126,300 | $119,800 |
Map
- 591 Blackrock Rd
- 594 Blackrock Rd
- 575 Blackrock Rd
- 601 Blackrock Rd
- 554 Blackrock Rd
- 600 Blackrock Rd
- 544 Blackrock Rd
- 607 Blackrock Rd
- 606 Blackrock Rd
- 3 Partridge Dr
- 5 Partridge Dr
- 534 Blackrock Rd
- 535 Blackrock Rd
- 351 Hill St
- 1 Partridge Dr
- 610 Blackrock Rd
- 371 Hill St
- 0 Manning Ct
- 12 Hawthorne Rd
- 524 Blackrock Rd
Ask me questions while you tour the home.