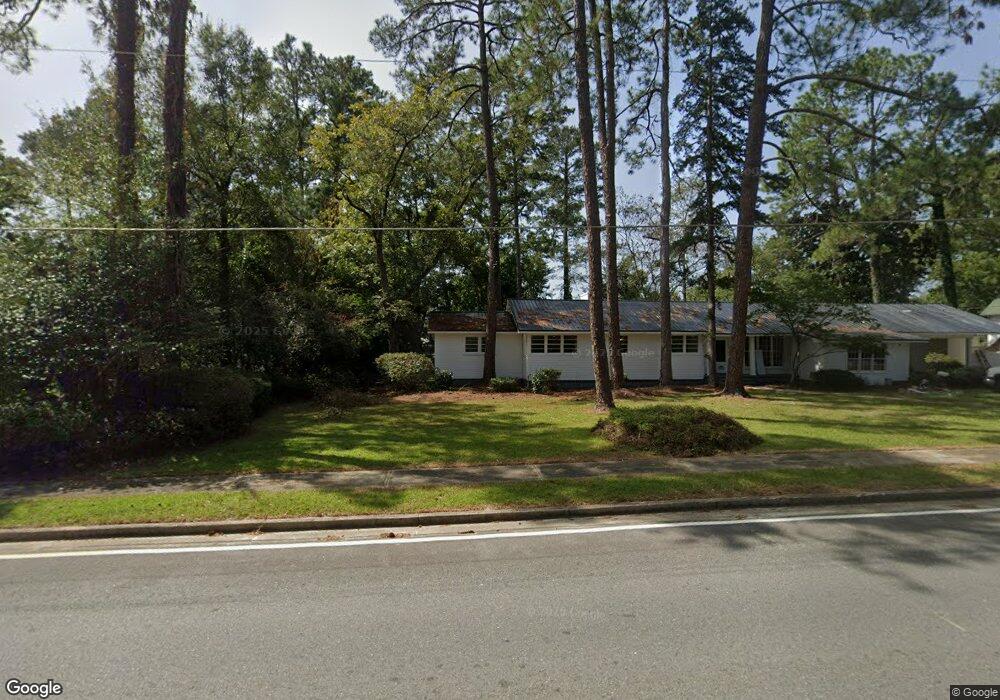
5857 E Main St Patterson, GA 31557
Estimated Value: $231,000 - $283,000
3
Beds
3
Baths
2,324
Sq Ft
$110/Sq Ft
Est. Value
About This Home
This home is located at 5857 E Main St, Patterson, GA 31557 and is currently estimated at $256,569, approximately $110 per square foot. 5857 E Main St is a home located in Pierce County with nearby schools including Pierce County High School and Southeast Christian Academy.
Ownership History
Date
Name
Owned For
Owner Type
Purchase Details
Closed on
Dec 14, 2023
Sold by
Nahallac Properties Inc
Bought by
Fanning Steven Joseph and Fanning Tiffany Keedy
Current Estimated Value
Home Financials for this Owner
Home Financials are based on the most recent Mortgage that was taken out on this home.
Original Mortgage
$223,850
Outstanding Balance
$219,555
Interest Rate
7.25%
Mortgage Type
FHA
Estimated Equity
$37,014
Purchase Details
Closed on
Jun 8, 2023
Sold by
Taylor Robin Phillips
Bought by
Nahallac Properties Inc
Home Financials for this Owner
Home Financials are based on the most recent Mortgage that was taken out on this home.
Original Mortgage
$154,599
Interest Rate
6.35%
Mortgage Type
New Conventional
Purchase Details
Closed on
Jun 14, 2022
Sold by
Thomas Sammie June
Bought by
Taylor Robin Phillips
Purchase Details
Closed on
Feb 18, 1993
Sold by
Thomas Agnes M Est
Bought by
Thomas Sammie June
Purchase Details
Closed on
Jan 14, 1964
Sold by
Tyre Mrs Evelyn Echols
Bought by
Thomas Mrs Agnes M
Create a Home Valuation Report for This Property
The Home Valuation Report is an in-depth analysis detailing your home's value as well as a comparison with similar homes in the area
Purchase History
| Date | Buyer | Sale Price | Title Company |
|---|---|---|---|
| Fanning Steven Joseph | $255,000 | -- | |
| Nahallac Properties Inc | $108,000 | -- | |
| Taylor Robin Phillips | -- | -- | |
| Thomas Sammie June | -- | -- | |
| Thomas Mrs Agnes M | -- | -- |
Source: Public Records
Mortgage History
| Date | Status | Borrower | Loan Amount |
|---|---|---|---|
| Open | Fanning Steven Joseph | $223,850 | |
| Previous Owner | Nahallac Properties Inc | $154,599 |
Source: Public Records
Tax History
| Year | Tax Paid | Tax Assessment Tax Assessment Total Assessment is a certain percentage of the fair market value that is determined by local assessors to be the total taxable value of land and additions on the property. | Land | Improvement |
|---|---|---|---|---|
| 2025 | $2,239 | $75,409 | $2,496 | $72,913 |
| 2024 | $2,183 | $72,870 | $2,496 | $70,374 |
| 2023 | $2,007 | $63,857 | $2,496 | $61,361 |
| 2022 | $1,755 | $49,475 | $2,800 | $46,675 |
| 2021 | $1,585 | $47,506 | $2,800 | $44,706 |
| 2020 | $1,529 | $45,536 | $2,800 | $42,736 |
| 2019 | $1,529 | $45,536 | $2,800 | $42,736 |
| 2018 | $1,455 | $43,566 | $2,800 | $40,766 |
| 2017 | $1,633 | $42,384 | $2,800 | $39,584 |
| 2016 | $1,410 | $42,384 | $2,800 | $39,584 |
| 2015 | $779 | $42,384 | $2,800 | $39,584 |
| 2014 | $779 | $42,384 | $2,800 | $39,584 |
| 2013 | $779 | $42,384 | $2,800 | $39,584 |
Source: Public Records
Map
Nearby Homes
- 3540 Williams St
- 3501 Martin St
- 5661 E Railroad Ave
- 5518 W Railroad Ave
- 3442 Wildwood Ave
- 3432 Nellie St
- 3440 Nellie St
- 5772 Industrial Blvd
- 3231 Pear Ave
- 3285 Tyre Bridge Rd
- 0 Eden Rd
- 5574 Walkerville Rd
- 5209 Georgia 32
- 5209 Ga Highway 32
- 6193 Offerman Loop
- 3587 Cathleen Dr
- 6204 Cross Swamp Rd
- 5817 Cantrell Rd
- 5466 Robin Rd
- 0 Otter Creek Rd Unit 23325273
- 5849 E Main St
- 5860 E Main St
- 5843 E Main St
- 3510 Williams St
- 3544 Williams St
- 5870 E Main St
- 5881 E Main St
- 5848 E Main St
- 5837 E Main St
- 3416 Hyers St
- 5889 E Main St
- 3554 Williams St
- 5880 E Main St
- 5597 E Railroad Ave
- Tract 2 Jessica Ln
- 5677 E Railroad Ave
- 5585 E Railroad Ave
- 5633 E Railroad Ave
- 0 Dallas St
- 3540 Dallas St
Your Personal Tour Guide
Ask me questions while you tour the home.