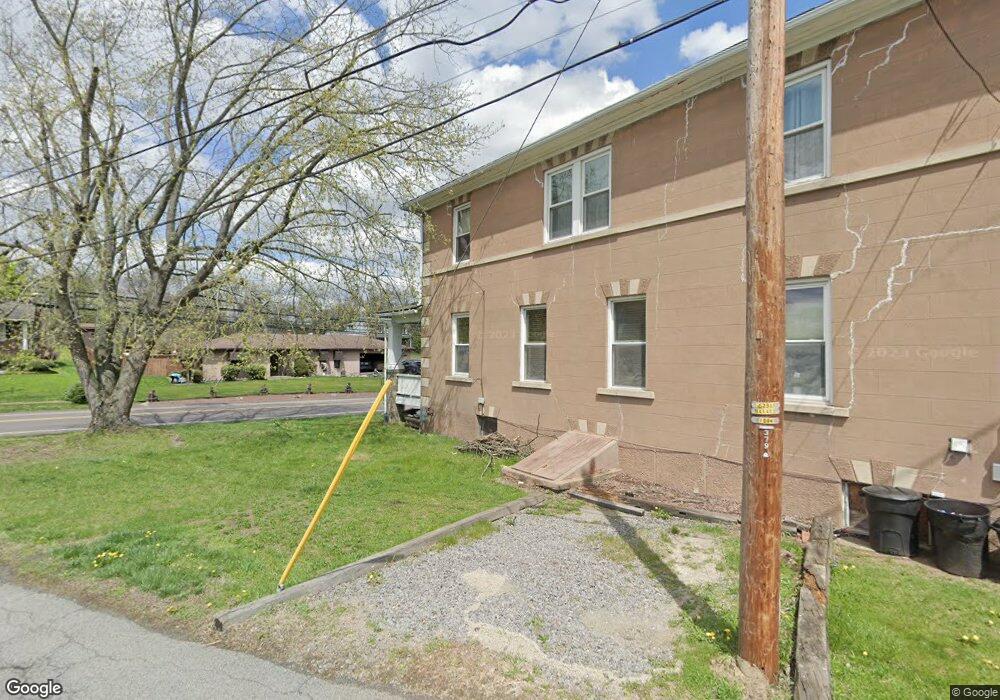
587 N Main St Plains, PA 18705
Estimated Value: $116,000 - $278,000
3
Beds
1
Bath
1,584
Sq Ft
$129/Sq Ft
Est. Value
About This Home
This home is located at 587 N Main St, Plains, PA 18705 and is currently estimated at $204,936, approximately $129 per square foot. 587 N Main St is a home located in Luzerne County with nearby schools including Leo E. Solomon-Plains Elementary School, Solomon/Plains Junior High School, and Wyoming Area Catholic School.
Ownership History
Date
Name
Owned For
Owner Type
Purchase Details
Closed on
Aug 16, 2018
Sold by
Assets Recovery 23 Llc
Bought by
Espinoza Luis
Current Estimated Value
Purchase Details
Closed on
May 19, 2014
Sold by
Kosloski Megan
Bought by
Assets Recovery 23 Llc
Purchase Details
Closed on
Jun 13, 2007
Sold by
Lanier Leon A and Lanier Anna K
Bought by
Kosloski Megan
Create a Home Valuation Report for This Property
The Home Valuation Report is an in-depth analysis detailing your home's value as well as a comparison with similar homes in the area
Home Values in the Area
Average Home Value in this Area
Purchase History
| Date | Buyer | Sale Price | Title Company |
|---|---|---|---|
| Espinoza Luis | $18,000 | Bilbow Abstract Llc | |
| Assets Recovery 23 Llc | $7,750 | None Available | |
| Kosloski Megan | $27,000 | None Available |
Source: Public Records
Tax History
| Year | Tax Paid | Tax Assessment Tax Assessment Total Assessment is a certain percentage of the fair market value that is determined by local assessors to be the total taxable value of land and additions on the property. | Land | Improvement |
|---|---|---|---|---|
| 2026 | $1,732 | $62,100 | $22,600 | $39,500 |
| 2025 | $1,662 | $62,100 | $22,600 | $39,500 |
| 2024 | $1,662 | $62,100 | $22,600 | $39,500 |
| 2023 | $1,662 | $62,100 | $22,600 | $39,500 |
| 2022 | $1,650 | $62,100 | $22,600 | $39,500 |
| 2021 | $1,650 | $62,100 | $22,600 | $39,500 |
| 2020 | $1,650 | $62,100 | $22,600 | $39,500 |
| 2019 | $1,601 | $62,100 | $22,600 | $39,500 |
| 2018 | $1,564 | $62,100 | $22,600 | $39,500 |
| 2017 | $1,528 | $62,100 | $22,600 | $39,500 |
| 2016 | -- | $62,100 | $22,600 | $39,500 |
| 2015 | $1,125 | $62,100 | $22,600 | $39,500 |
| 2014 | $1,125 | $62,100 | $22,600 | $39,500 |
Source: Public Records
Map
Nearby Homes
Your Personal Tour Guide
Ask me questions while you tour the home.