59 Cushing Rd Warwick, RI 02888
Spring Green NeighborhoodEstimated Value: $433,000 - $573,726
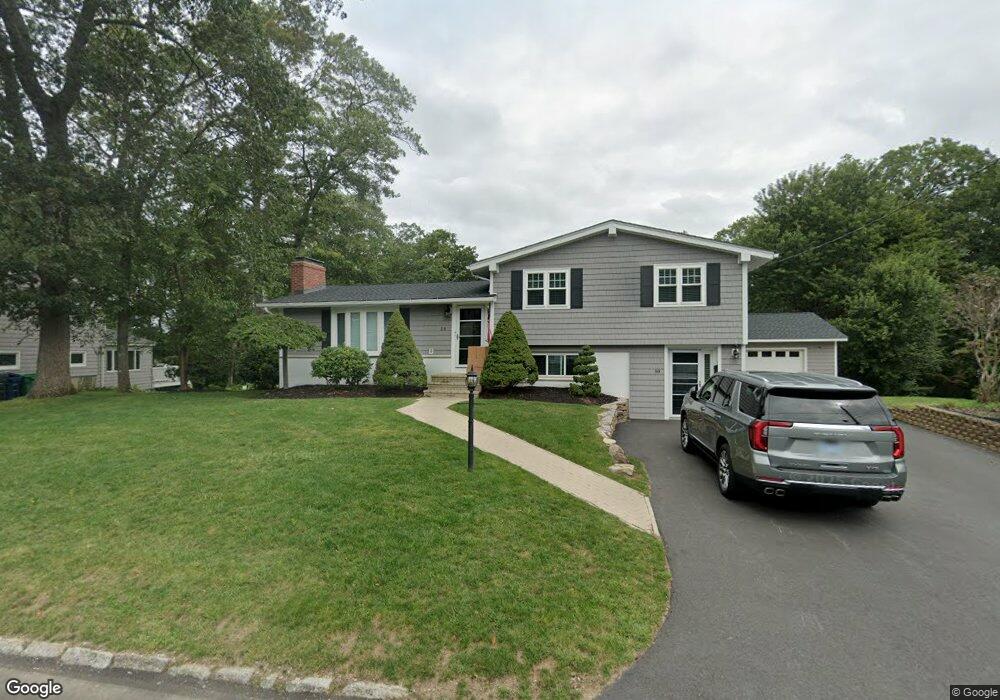
About This Home
This home is located at 59 Cushing Rd, Warwick, RI 02888 and is currently estimated at $512,932, approximately $380 per square foot. 59 Cushing Rd is a home located in Kent County with nearby schools including St. Peter School and Saint Paul School.
Ownership History
We collect this data history from publicly available records. To have your information removed, we recommend requesting removal directly through your county’s website.
Purchase Details
Purchase Details
Home Financials for this Owner
Home Financials are based on the most recent Mortgage that was taken out on this home.Home Values in the Area
Average Home Value in this Area
Purchase History
We collect this data history from publicly available records. To have your information removed, we recommend requesting removal directly through your county’s website.
| Date | Buyer | Sale Price | Title Company |
|---|---|---|---|
| -- | -- | ||
| $210,000 | -- |
Mortgage History
We collect this data history from publicly available records. To have your information removed, we recommend requesting removal directly through your county’s website.
| Date | Status | Borrower | Loan Amount |
|---|---|---|---|
| Previous Owner | $90,000 | ||
| Closed | $150,346 | ||
| Previous Owner | $20,000 | ||
| Previous Owner | $189,000 | ||
| Previous Owner | $99,000 | ||
| Previous Owner | $120,000 |
Tax History
We collect this data history from publicly available records. To have your information removed, we recommend requesting removal directly through your county’s website.
| Year | Tax Paid | Tax Assessment Tax Assessment Total Assessment is a certain percentage of the fair market value that is determined by local assessors to be the total taxable value of land and additions on the property. | Land | Improvement |
|---|---|---|---|---|
| 2025 | $6,166 | $485,500 | $137,800 | $347,700 |
| 2024 | $5,775 | $399,100 | $119,800 | $279,300 |
| 2023 | $5,663 | $399,100 | $119,800 | $279,300 |
| 2022 | $5,475 | $292,300 | $79,400 | $212,900 |
| 2021 | $5,475 | $292,300 | $79,400 | $212,900 |
| 2020 | $5,228 | $279,100 | $79,400 | $199,700 |
| 2019 | $4,932 | $263,300 | $79,400 | $183,900 |
| 2018 | $5,269 | $253,300 | $88,600 | $164,700 |
| 2017 | $5,127 | $253,300 | $88,600 | $164,700 |
| 2016 | $5,127 | $253,300 | $88,600 | $164,700 |
| 2015 | $5,214 | $251,300 | $98,900 | $152,400 |
| 2014 | $5,041 | $251,300 | $98,900 | $152,400 |
| 2013 | $4,973 | $251,300 | $98,900 | $152,400 |
Map
- 119 Cushing Rd
- 41 Shirley St
- 873 Warwick Ave
- 116 Benbridge Ave
- 268 Washington St
- 136 Sherwood Ave
- 222 Harrison Ave
- 56 Errol St
- 5 Thayer Place
- 1201 Narragansett Pkwy
- 0 Elmwood Ave
- 21 Falcon Ave
- 205 Pawtuxet Ave
- 131 Welfare Ave
- 396 Norwood Ave
- 330 Manolla Ave
- 70 Perkins Ave
- 31 Todd St
- 200 Post Rd Unit 233
- 200 Post Rd Unit 319
Ask me questions while you tour the home.