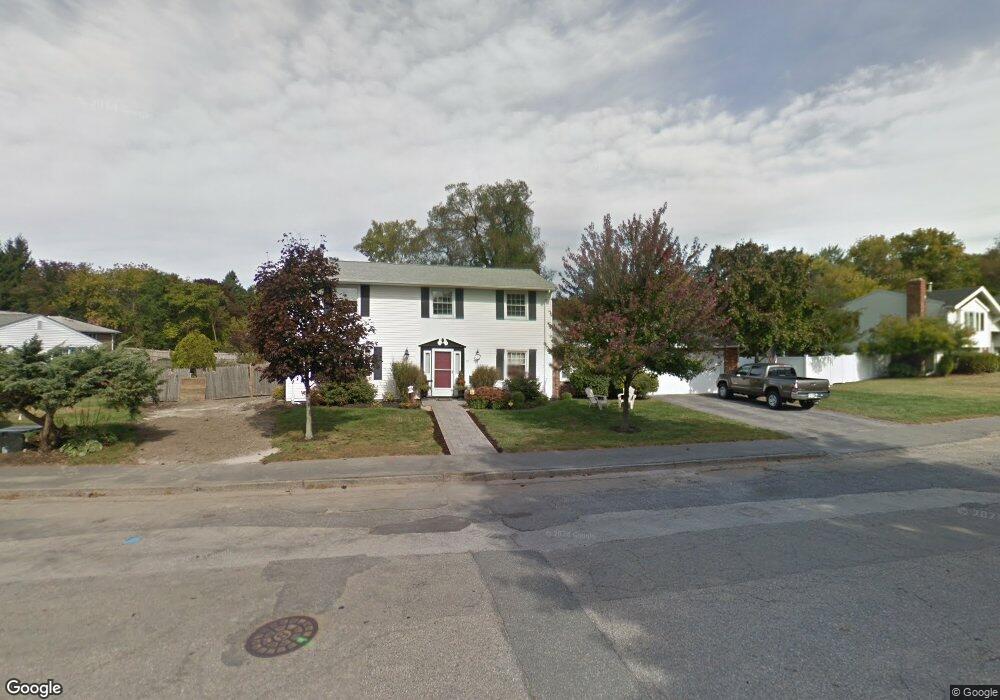
59 Logan Dr Braintree, MA 02184
East Braintree NeighborhoodEstimated Value: $888,323 - $964,000
4
Beds
3
Baths
2,342
Sq Ft
$396/Sq Ft
Est. Value
About This Home
This home is located at 59 Logan Dr, Braintree, MA 02184 and is currently estimated at $927,331, approximately $395 per square foot. 59 Logan Dr is a home located in Norfolk County with nearby schools including Braintree High School, Sacred Heart Elementary School, and Step Ahead Kindergarten.
Ownership History
Date
Name
Owned For
Owner Type
Purchase Details
Closed on
Apr 28, 2010
Sold by
Morrissey Peter J
Bought by
Caldwell Kenneth P and Caldwell Elizabeth M
Current Estimated Value
Home Financials for this Owner
Home Financials are based on the most recent Mortgage that was taken out on this home.
Original Mortgage
$360,000
Outstanding Balance
$240,583
Interest Rate
4.99%
Mortgage Type
Purchase Money Mortgage
Estimated Equity
$686,748
Create a Home Valuation Report for This Property
The Home Valuation Report is an in-depth analysis detailing your home's value as well as a comparison with similar homes in the area
Home Values in the Area
Average Home Value in this Area
Purchase History
| Date | Buyer | Sale Price | Title Company |
|---|---|---|---|
| Caldwell Kenneth P | $450,000 | -- |
Source: Public Records
Mortgage History
| Date | Status | Borrower | Loan Amount |
|---|---|---|---|
| Open | Caldwell Kenneth P | $360,000 |
Source: Public Records
Tax History
| Year | Tax Paid | Tax Assessment Tax Assessment Total Assessment is a certain percentage of the fair market value that is determined by local assessors to be the total taxable value of land and additions on the property. | Land | Improvement |
|---|---|---|---|---|
| 2025 | $7,862 | $787,800 | $379,100 | $408,700 |
| 2024 | $7,055 | $744,200 | $349,200 | $395,000 |
| 2023 | $6,784 | $695,100 | $319,300 | $375,800 |
| 2022 | $6,519 | $655,200 | $279,400 | $375,800 |
| 2021 | $6,059 | $608,900 | $252,400 | $356,500 |
| 2020 | $5,778 | $586,000 | $229,500 | $356,500 |
| 2019 | $5,635 | $558,500 | $229,500 | $329,000 |
| 2018 | $5,446 | $516,700 | $199,500 | $317,200 |
| 2017 | $5,315 | $494,900 | $189,600 | $305,300 |
| 2016 | $5,155 | $469,500 | $179,600 | $289,900 |
| 2015 | $5,043 | $455,600 | $175,600 | $280,000 |
| 2014 | $4,786 | $419,100 | $152,600 | $266,500 |
Source: Public Records
Map
Nearby Homes
- 16 Coolidge Ave
- 9 Doris Rd
- 3 Harrison Ave
- 480 Liberty St
- 599 Union St
- 632 Washington St Unit G6
- 56 Congress St
- 5 Woodsum Dr Unit 5
- 77 French Ave
- 302 Commercial St Unit 21
- 491 Washington St Unit 1
- 296 Commercial St Unit 21
- 24 Brow Ave
- 84 Poulos Rd
- 38 Stonewood Ln
- 37 Lantern Ln
- 41 Lantern Ln
- 82 Lester Ln
- 83 Franklin St
- 140 Commercial St
Your Personal Tour Guide
Ask me questions while you tour the home.