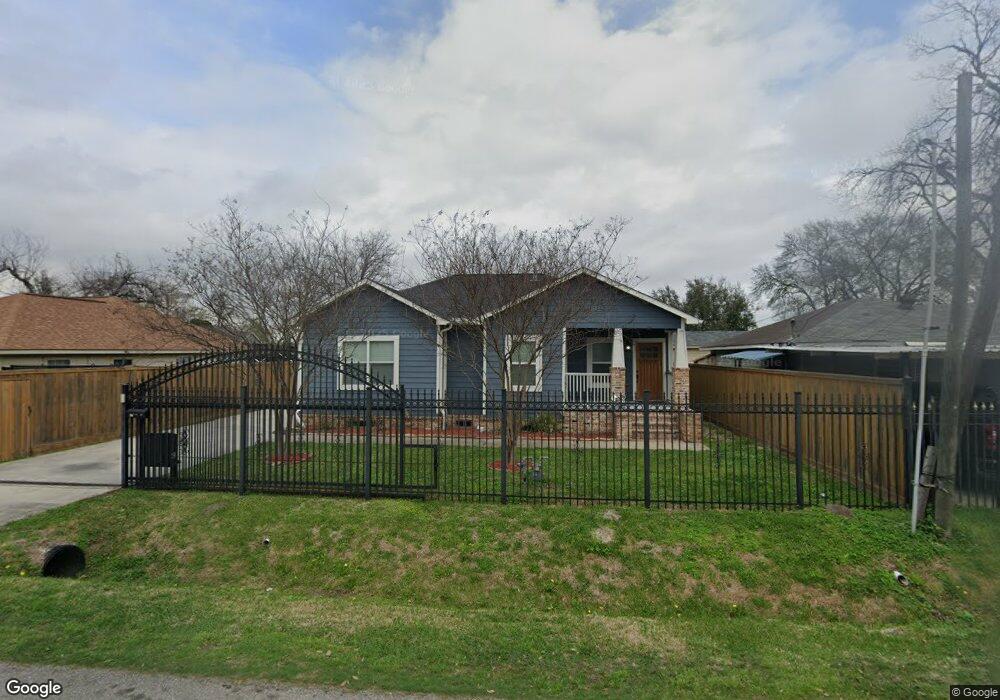
59 Neyland St Houston, TX 77022
Northside-Northline NeighborhoodEstimated Value: $298,000 - $344,678
3
Beds
2
Baths
1,606
Sq Ft
$204/Sq Ft
Est. Value
About This Home
This home is located at 59 Neyland St, Houston, TX 77022 and is currently estimated at $327,170, approximately $203 per square foot. 59 Neyland St is a home located in Harris County with nearby schools including Herrera Elementary School, Burbank Middle School, and Sam Houston Math, Science & Technology Center.
Ownership History
Date
Name
Owned For
Owner Type
Purchase Details
Closed on
Nov 27, 2019
Sold by
Eg1 Solo Properties Investments Llc
Bought by
Garcia Eliu
Current Estimated Value
Purchase Details
Closed on
Aug 23, 2016
Sold by
Garcia Eliu
Bought by
Egi Solo Properties Investments Llc
Purchase Details
Closed on
Aug 13, 2014
Sold by
Laura Lauder L and Lauder Melvin W
Bought by
Garcia Eliu
Create a Home Valuation Report for This Property
The Home Valuation Report is an in-depth analysis detailing your home's value as well as a comparison with similar homes in the area
Home Values in the Area
Average Home Value in this Area
Purchase History
We collect this data history from publicly available records. To have your information removed, we recommend requesting removal directly through your county’s website.
| Date | Buyer | Sale Price | Title Company |
|---|---|---|---|
| Garcia Eliu | -- | None Available | |
| Egi Solo Properties Investments Llc | -- | None Available | |
| Garcia Eliu | -- | First American Title | |
| Garcia Eliu | -- | First American Title |
Source: Public Records
Tax History
| Year | Tax Paid | Tax Assessment Tax Assessment Total Assessment is a certain percentage of the fair market value that is determined by local assessors to be the total taxable value of land and additions on the property. | Land | Improvement |
|---|---|---|---|---|
| 2025 | $4,222 | $351,761 | $93,500 | $258,261 |
| 2024 | $4,222 | $303,577 | $93,500 | $210,077 |
| 2023 | $4,222 | $331,602 | $81,125 | $250,477 |
| 2022 | $6,090 | $298,682 | $60,500 | $238,182 |
| 2021 | $5,860 | $251,432 | $60,500 | $190,932 |
| 2020 | $5,600 | $231,255 | $60,500 | $170,755 |
| 2019 | $5,616 | $221,932 | $49,500 | $172,432 |
| 2018 | $5,206 | $205,754 | $34,375 | $171,379 |
| 2017 | $4,293 | $169,788 | $34,375 | $135,413 |
| 2016 | $4,293 | $169,788 | $34,375 | $135,413 |
| 2015 | $495 | $27,500 | $27,500 | $0 |
| 2014 | $495 | $19,250 | $19,250 | $0 |
Source: Public Records
Map
Nearby Homes
- 64 Neyland St
- 206 Oddo St
- 208 Oddo St
- 118 Van Molan St
- 0 E 31st St Unit 75519178
- 7820 Fulton St
- 220 Palmyra St
- 1315 Neyland St
- 129 Garrotsville St
- 210 Garrotsville St
- 1228 Johnston St
- 230 Wallace St
- 1216 Johnston St Unit A/B
- 7317 Roswell St
- 7115 Roswell St
- 244 Deerfield St
- 1107 E 40th 1 2 St
- 246 Rebecca St
- 7009 Roswell St
- 330 Dorchester St
Your Personal Tour Guide
Ask me questions while you tour the home.