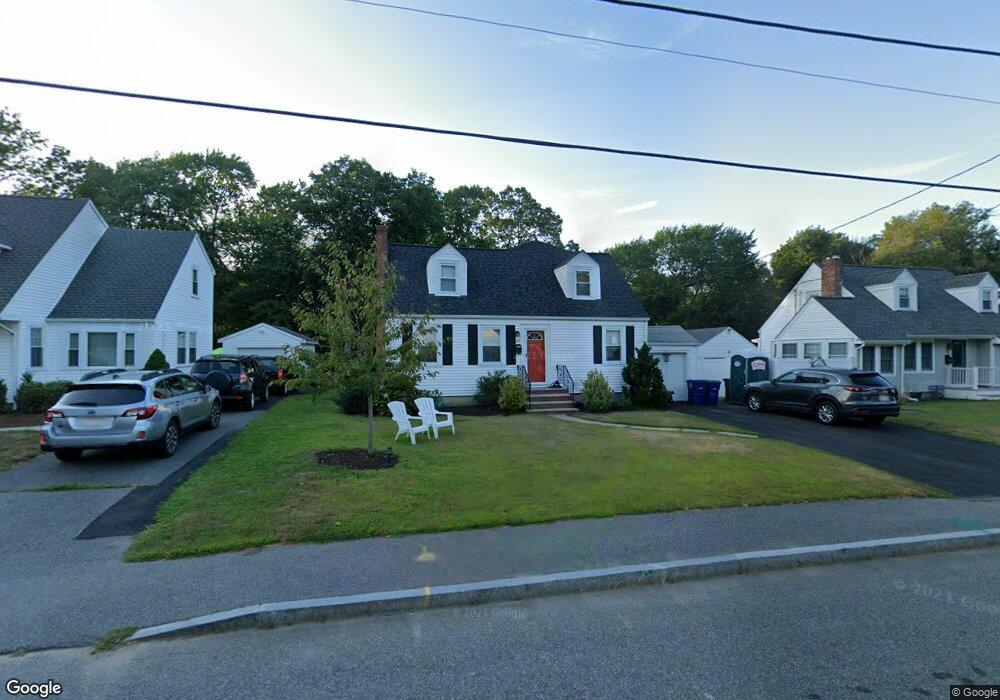
59 Parkside Ave Braintree, MA 02184
North Braintree NeighborhoodEstimated Value: $694,000 - $733,000
3
Beds
1
Bath
1,656
Sq Ft
$428/Sq Ft
Est. Value
About This Home
This home is located at 59 Parkside Ave, Braintree, MA 02184 and is currently estimated at $708,937, approximately $428 per square foot. 59 Parkside Ave is a home located in Norfolk County with nearby schools including Braintree High School, Step Ahead Kindergarten, and Meeting House Montessori School.
Ownership History
Date
Name
Owned For
Owner Type
Purchase Details
Closed on
May 26, 2010
Sold by
Stevenson Harry
Bought by
Leary Daniel
Current Estimated Value
Home Financials for this Owner
Home Financials are based on the most recent Mortgage that was taken out on this home.
Original Mortgage
$300,947
Outstanding Balance
$197,809
Interest Rate
5.13%
Mortgage Type
Purchase Money Mortgage
Estimated Equity
$511,128
Create a Home Valuation Report for This Property
The Home Valuation Report is an in-depth analysis detailing your home's value as well as a comparison with similar homes in the area
Home Values in the Area
Average Home Value in this Area
Purchase History
We collect this data history from publicly available records. To have your information removed, we recommend requesting removal directly through your county’s website.
| Date | Buyer | Sale Price | Title Company |
|---|---|---|---|
| Leary Daniel | $305,000 | -- | |
| Leary Daniel | $305,000 | -- |
Source: Public Records
Mortgage History
We collect this data history from publicly available records. To have your information removed, we recommend requesting removal directly through your county’s website.
| Date | Status | Borrower | Loan Amount |
|---|---|---|---|
| Open | Leary Daniel | $300,947 | |
| Closed | Leary Daniel | $300,947 |
Source: Public Records
Tax History
| Year | Tax Paid | Tax Assessment Tax Assessment Total Assessment is a certain percentage of the fair market value that is determined by local assessors to be the total taxable value of land and additions on the property. | Land | Improvement |
|---|---|---|---|---|
| 2025 | $6,134 | $614,600 | $371,400 | $243,200 |
| 2024 | $5,575 | $588,100 | $348,200 | $239,900 |
| 2023 | $5,201 | $532,900 | $306,400 | $226,500 |
| 2022 | $5,025 | $505,000 | $278,500 | $226,500 |
| 2021 | $4,390 | $441,200 | $234,900 | $206,300 |
| 2020 | $4,350 | $441,200 | $234,900 | $206,300 |
| 2019 | $4,292 | $425,400 | $234,900 | $190,500 |
| 2018 | $4,076 | $386,700 | $204,300 | $182,400 |
| 2017 | $3,867 | $360,100 | $185,700 | $174,400 |
| 2016 | $3,525 | $321,000 | $167,100 | $153,900 |
| 2015 | $3,463 | $312,800 | $163,400 | $149,400 |
| 2014 | $3,281 | $287,300 | $150,400 | $136,900 |
Source: Public Records
Map
Nearby Homes
- 18 Howie Rd
- 78 Windemere Cir
- 241 Walnut St
- 30 Church St Unit 12
- 491 Washington St Unit 1
- 98 West St
- 80 Hollingsworth Ave
- 9 Independence Ave Unit 102
- 115 Hawthorn Rd
- 11 Oak Grove Terrace Unit 303
- 11 Oak Grove Terrace Unit 402
- 199 Hawthorn Rd
- 24 Brow Ave
- 55 Hobart Ave
- 5 Woodsum Dr Unit 5
- 31 Brierwood Rd
- 21 Totman St Unit 205
- 21 Totman St Unit 210
- 21 Totman St Unit 302
- 21 Totman St Unit 403
- 64 Parkside Ave
- 58 Parkside Ave
- 70 Parkside Ave
- 54 Parkside Ave
- 31 Sheffield Dr
- 41 Sheffield Dr
- 63 Parkside Ave
- 50 Parkside Ave
- 78 Parkside Ave
- 69 Parkside Ave
- 21 Sheffield Dr
- 73 Parkside Ave
- 82 Parkside Ave
- 42 Parkside Ave
- 79 Parkside Ave
- 51 Sheffield Dr
- 49 Parkside Ave
- 11 Sheffield Dr
- 83 Parkside Ave
- 86 Parkside Ave
Your Personal Tour Guide
Ask me questions while you tour the home.