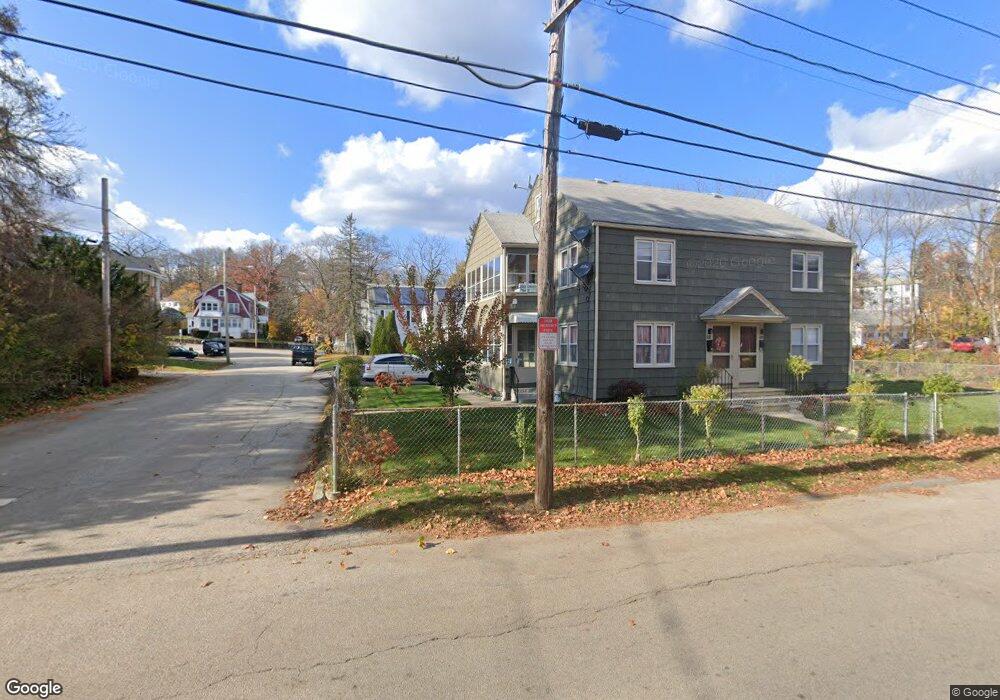
59 Taft St Southbridge, MA 01550
Estimated Value: $330,000 - $350,000
2
Beds
1
Bath
1,404
Sq Ft
$242/Sq Ft
Est. Value
About This Home
This home is located at 59 Taft St, Southbridge, MA 01550 and is currently estimated at $340,156, approximately $242 per square foot. 59 Taft St is a home located in Worcester County with nearby schools including Trinity Catholic Academy.
Ownership History
Date
Name
Owned For
Owner Type
Purchase Details
Closed on
Oct 28, 2004
Sold by
Urbanowski Jennie
Bought by
Ciemiega Alojzy A and Ciemiega Krystyna
Current Estimated Value
Home Financials for this Owner
Home Financials are based on the most recent Mortgage that was taken out on this home.
Original Mortgage
$149,400
Outstanding Balance
$73,324
Interest Rate
5.74%
Mortgage Type
Purchase Money Mortgage
Estimated Equity
$266,832
Create a Home Valuation Report for This Property
The Home Valuation Report is an in-depth analysis detailing your home's value as well as a comparison with similar homes in the area
Home Values in the Area
Average Home Value in this Area
Purchase History
| Date | Buyer | Sale Price | Title Company |
|---|---|---|---|
| Ciemiega Alojzy A | $166,000 | -- | |
| Ciemiega Alojzy A | $166,000 | -- |
Source: Public Records
Mortgage History
| Date | Status | Borrower | Loan Amount |
|---|---|---|---|
| Open | Ciemiega Alojzy A | $45,300 | |
| Open | Ciemiega Alojzy A | $149,400 | |
| Closed | Ciemiega Alojzy A | $149,400 |
Source: Public Records
Tax History
| Year | Tax Paid | Tax Assessment Tax Assessment Total Assessment is a certain percentage of the fair market value that is determined by local assessors to be the total taxable value of land and additions on the property. | Land | Improvement |
|---|---|---|---|---|
| 2025 | $4,376 | $298,500 | $34,500 | $264,000 |
| 2024 | $4,491 | $294,300 | $28,800 | $265,500 |
| 2023 | $4,294 | $271,100 | $28,800 | $242,300 |
| 2022 | $4,058 | $226,700 | $24,600 | $202,100 |
| 2021 | $3,836 | $197,300 | $24,600 | $172,700 |
| 2020 | $3,662 | $188,000 | $24,600 | $163,400 |
| 2018 | $3,469 | $167,200 | $21,800 | $145,400 |
| 2017 | $3,223 | $156,700 | $21,800 | $134,900 |
| 2016 | $3,048 | $150,800 | $21,800 | $129,000 |
| 2015 | $2,881 | $141,500 | $21,800 | $119,700 |
| 2014 | $2,663 | $135,600 | $21,800 | $113,800 |
Source: Public Records
Map
Nearby Homes
- 130 Marcy St
- 53 Taft St
- 53 Taft St Unit 1
- 120 Marcy St
- 120 Marcy St Unit 3
- 120 Marcy St Unit 2
- 120 Marcy St Unit 1
- 43 Taft St
- 146 Marcy St
- 56 Taft St
- 135 Marcy St
- 135 Marcy St Unit 2
- 135 Marcy St Unit 3
- 150 Marcy St
- 119 Marcy St
- 141 Marcy St
- 13 South St Unit 2
- 147 Marcy St
- 147 Marcy St Unit 2
- 41 1/2 Taft St
Your Personal Tour Guide
Ask me questions while you tour the home.