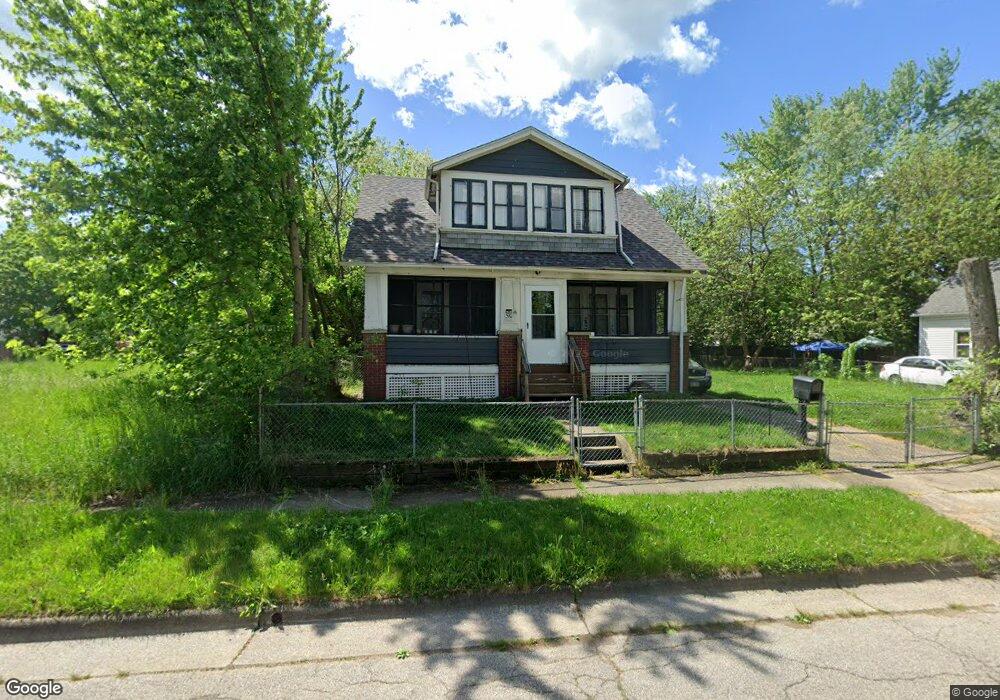
590 Corice St Akron, OH 44311
South Akron NeighborhoodEstimated Value: $78,379 - $108,000
4
Beds
1
Bath
1,424
Sq Ft
$62/Sq Ft
Est. Value
About This Home
This home is located at 590 Corice St, Akron, OH 44311 and is currently estimated at $88,345, approximately $62 per square foot. 590 Corice St is a home located in Summit County with nearby schools including Glover Community Learning Center, Kenmore Garfield Community Learning Center, and Main Preparatory Academy.
Ownership History
Date
Name
Owned For
Owner Type
Purchase Details
Closed on
Aug 9, 2022
Sold by
Tktk Llc
Bought by
Simons Lori Louise
Current Estimated Value
Purchase Details
Closed on
Aug 12, 2016
Sold by
Simons Land Properties Llc
Bought by
Tktk Llc
Purchase Details
Closed on
Dec 17, 2015
Sold by
Manchester Mortgage Investments Llc
Bought by
Simons Land Properties Llc
Purchase Details
Closed on
Aug 10, 2011
Sold by
Simons Chester and Simons Chester L
Bought by
Manchester Mortgage Investments Llc
Purchase Details
Closed on
Jun 29, 2009
Sold by
Rosenbaum Ladonna
Bought by
Simons Chester L
Create a Home Valuation Report for This Property
The Home Valuation Report is an in-depth analysis detailing your home's value as well as a comparison with similar homes in the area
Home Values in the Area
Average Home Value in this Area
Purchase History
We collect this data history from publicly available records. To have your information removed, we recommend requesting removal directly through your county’s website.
| Date | Buyer | Sale Price | Title Company |
|---|---|---|---|
| Simons Lori Louise | -- | None Listed On Document | |
| Tktk Llc | -- | None Available | |
| Simons Land Properties Llc | -- | First American Title | |
| Manchester Mortgage Investments Llc | -- | None Available | |
| Simons Chester L | $10,000 | Attorney |
Source: Public Records
Tax History
| Year | Tax Paid | Tax Assessment Tax Assessment Total Assessment is a certain percentage of the fair market value that is determined by local assessors to be the total taxable value of land and additions on the property. | Land | Improvement |
|---|---|---|---|---|
| 2025 | $528 | $16,541 | $5,362 | $11,179 |
| 2024 | $528 | $16,541 | $5,362 | $11,179 |
| 2023 | $528 | $16,541 | $5,362 | $11,179 |
| 2022 | $867 | $10,704 | $3,154 | $7,550 |
| 2021 | $868 | $10,704 | $3,154 | $7,550 |
| 2020 | $857 | $10,700 | $3,150 | $7,550 |
| 2019 | $1,130 | $13,490 | $5,510 | $7,980 |
| 2018 | $1,117 | $13,490 | $5,510 | $7,980 |
| 2017 | $965 | $13,490 | $5,510 | $7,980 |
| 2016 | $1,147 | $13,680 | $5,510 | $8,170 |
| 2015 | $965 | $12,230 | $4,060 | $8,170 |
| 2014 | $958 | $12,230 | $4,060 | $8,170 |
| 2013 | $941 | $12,250 | $4,060 | $8,190 |
Source: Public Records
Map
Nearby Homes
Your Personal Tour Guide
Ask me questions while you tour the home.