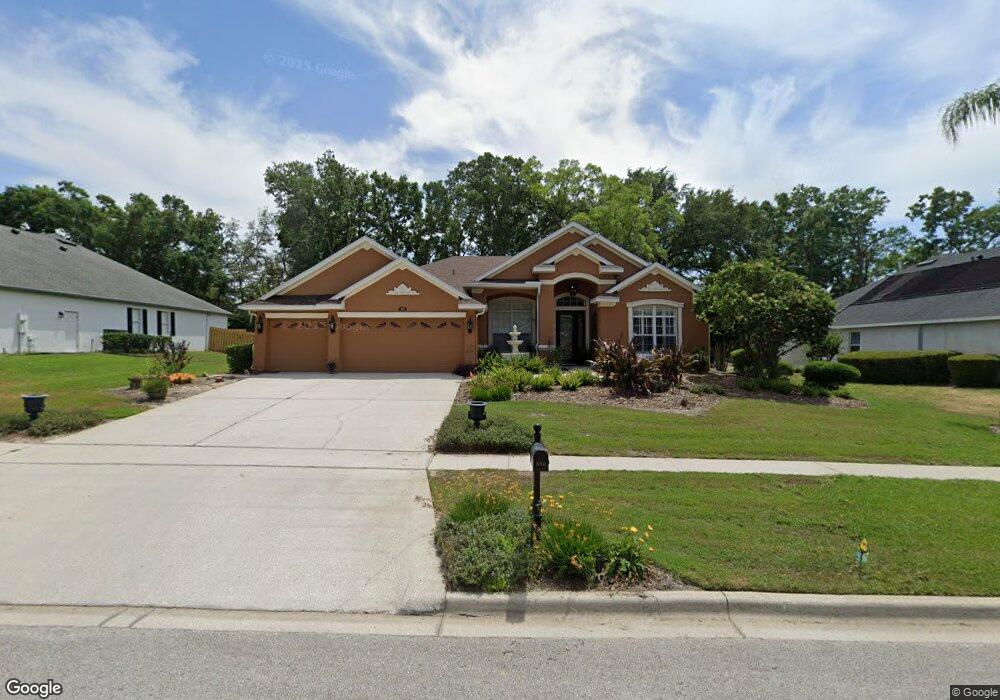
590 Sand Wedge Loop Apopka, FL 32712
Estimated Value: $617,664 - $695,000
4
Beds
3
Baths
3,064
Sq Ft
$211/Sq Ft
Est. Value
About This Home
This home is located at 590 Sand Wedge Loop, Apopka, FL 32712 and is currently estimated at $646,916, approximately $211 per square foot. 590 Sand Wedge Loop is a home located in Orange County with nearby schools including Apopka High School.
Ownership History
Date
Name
Owned For
Owner Type
Purchase Details
Closed on
Feb 2, 2009
Sold by
Payne Mark and Payne Kimberly
Bought by
Payne Mark and Payne Kimberly
Current Estimated Value
Purchase Details
Closed on
Sep 30, 2002
Sold by
Cambridge Homes Ltd
Bought by
Payne Mark and Payne Kimberly
Home Financials for this Owner
Home Financials are based on the most recent Mortgage that was taken out on this home.
Original Mortgage
$243,350
Outstanding Balance
$102,246
Interest Rate
6.19%
Mortgage Type
New Conventional
Estimated Equity
$544,670
Create a Home Valuation Report for This Property
The Home Valuation Report is an in-depth analysis detailing your home's value as well as a comparison with similar homes in the area
Home Values in the Area
Average Home Value in this Area
Purchase History
| Date | Buyer | Sale Price | Title Company |
|---|---|---|---|
| Payne Mark | -- | Attorney | |
| Payne Mark | $304,700 | -- |
Source: Public Records
Mortgage History
| Date | Status | Borrower | Loan Amount |
|---|---|---|---|
| Open | Payne Mark | $60,414 | |
| Open | Payne Mark | $243,350 |
Source: Public Records
Tax History
| Year | Tax Paid | Tax Assessment Tax Assessment Total Assessment is a certain percentage of the fair market value that is determined by local assessors to be the total taxable value of land and additions on the property. | Land | Improvement |
|---|---|---|---|---|
| 2025 | $3,750 | $283,558 | -- | -- |
| 2024 | $3,430 | $275,567 | -- | -- |
| 2023 | $3,430 | $260,001 | $0 | $0 |
| 2022 | $3,348 | $252,428 | $0 | $0 |
| 2021 | $3,298 | $245,076 | $0 | $0 |
| 2020 | $3,159 | $241,692 | $0 | $0 |
| 2019 | $3,212 | $236,258 | $0 | $0 |
| 2018 | $3,182 | $231,853 | $0 | $0 |
| 2017 | $3,097 | $285,064 | $50,000 | $235,064 |
| 2016 | $3,091 | $271,273 | $22,000 | $249,273 |
| 2015 | $3,062 | $265,432 | $22,000 | $243,432 |
| 2014 | $3,084 | $256,428 | $35,000 | $221,428 |
Source: Public Records
Map
Nearby Homes
- 595 Sand Wedge Loop
- 597 Sand Wedge Loop
- 4323 Caledonia Ave
- 4385 Sea Rock Ct
- 833 Rock Creek St
- 756 Rock Creek St
- 401 Kentucky Blue Cir
- 934 Rock Creek St
- 3808 Caledonia Ave
- 311 W Lewis Ave
- 1509 Spinfisher Dr
- 1533 Spinfisher Dr
- 3712 Clydebank Ct
- 5137 Mount Plymouth Rd
- 1055 Rock Creek St
- 1042 Spinning Wheel Dr
- 1037 Truffles Ct
- 1305 W Kelly Park Rd
- 55 Oak Hollow Dr
- 1614 Spinfisher Dr
- 588 Sand Wedge Loop
- 592 Sand Wedge Loop
- 594 Sand Wedge Loop
- 591 Sand Wedge Loop
- 589 Sand Wedge Loop
- 584 Sand Wedge Loop
- 596 Sand Wedge Loop
- 593 Sand Wedge Loop
- 587 Sand Wedge Loop
- 585 Sand Wedge Loop
- 582 Sand Wedge Loop
- 598 Sand Wedge Loop
- 302 Kentucky Blue Cir
- 4379 Caledonia Ave
- 583 Sand Wedge Loop
- 515 Sand Wedge Loop
- 312 Kentucky Blue Cir
- 511 Sand Wedge Loop
- 517 Sand Wedge Loop
Your Personal Tour Guide
Ask me questions while you tour the home.