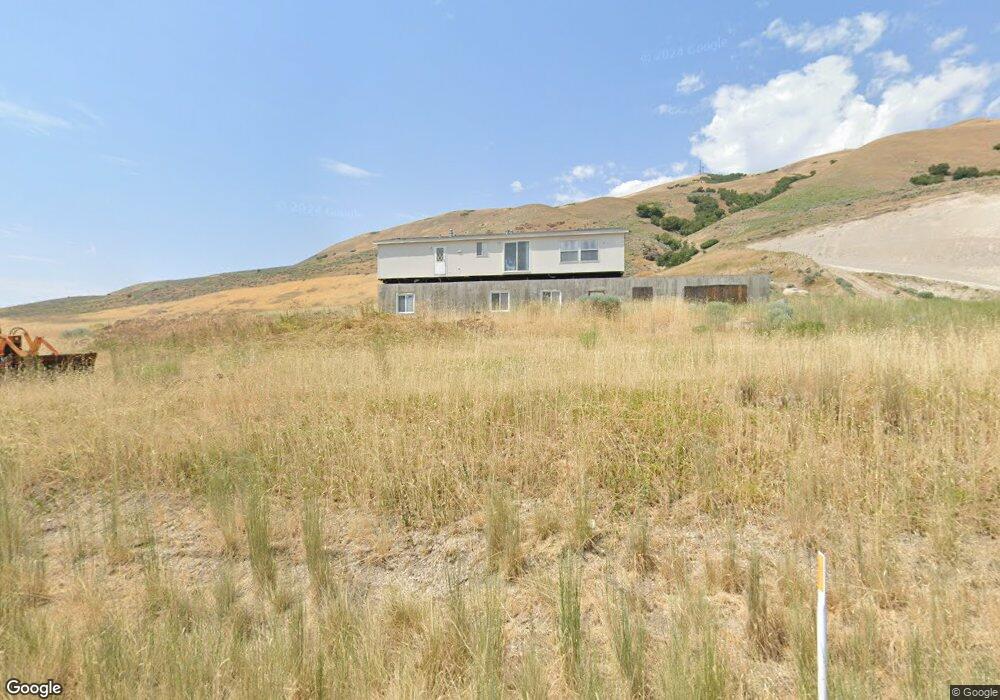
5905 N Highway 23 Cache Junction, UT 84304
Estimated Value: $545,000 - $580,000
5
Beds
2
Baths
2,550
Sq Ft
$222/Sq Ft
Est. Value
About This Home
This home is located at 5905 N Highway 23, Cache Junction, UT 84304 and is currently estimated at $565,987, approximately $221 per square foot. 5905 N Highway 23 is a home located in Cache County with nearby schools including Lewiston School, White Pine Middle School, and North Cache Middle School.
Ownership History
Date
Name
Owned For
Owner Type
Purchase Details
Closed on
Jun 14, 2021
Sold by
Haws Kim
Bought by
Kunzler Jonathan and Kunzler Nicole
Current Estimated Value
Purchase Details
Closed on
Jun 11, 2021
Sold by
Haws Kim
Bought by
Kunzler Jonathan and Kunzler Nicole
Purchase Details
Closed on
Nov 7, 2019
Sold by
Jennifer Griffin
Bought by
Jonathan Kunzler and Jonathan Nicole Kunzler
Home Financials for this Owner
Home Financials are based on the most recent Mortgage that was taken out on this home.
Original Mortgage
$313,880
Interest Rate
3.6%
Mortgage Type
New Conventional
Purchase Details
Closed on
Jan 31, 2017
Sold by
Griffin Chris H and Griffin Jennifer
Bought by
Griffin Christopher and Griffin Jennifer
Create a Home Valuation Report for This Property
The Home Valuation Report is an in-depth analysis detailing your home's value as well as a comparison with similar homes in the area
Purchase History
We collect this data history from publicly available records. To have your information removed, we recommend requesting removal directly through your county’s website.
| Date | Buyer | Sale Price | Title Company |
|---|---|---|---|
| Kunzler Jonathan | -- | Land Title | |
| Kunzler Jonathan | -- | Accommodation | |
| Jonathan Kunzler | -- | Hickman Land Title Logan | |
| Griffin Christopher | -- | None Available |
Source: Public Records
Mortgage History
We collect this data history from publicly available records. To have your information removed, we recommend requesting removal directly through your county’s website.
| Date | Status | Borrower | Loan Amount |
|---|---|---|---|
| Previous Owner | Jonathan Kunzler | $313,880 |
Source: Public Records
Tax History
| Year | Tax Paid | Tax Assessment Tax Assessment Total Assessment is a certain percentage of the fair market value that is determined by local assessors to be the total taxable value of land and additions on the property. | Land | Improvement |
|---|---|---|---|---|
| 2025 | $2,085 | $335,090 | $0 | $0 |
| 2024 | $1,758 | $261,100 | $0 | $0 |
| 2023 | $1,870 | $260,220 | $0 | $0 |
| 2022 | $1,957 | $260,225 | $0 | $0 |
| 2021 | $1,923 | $388,250 | $73,250 | $315,000 |
| 2020 | $1,407 | $266,036 | $73,250 | $192,786 |
| 2019 | $1,306 | $244,536 | $51,750 | $192,786 |
| 2018 | $1,202 | $219,390 | $51,750 | $167,640 |
| 2017 | $1,166 | $109,070 | $0 | $0 |
| 2016 | $1,181 | $115,320 | $0 | $0 |
| 2015 | $1,051 | $97,230 | $0 | $0 |
| 2014 | $1,020 | $97,230 | $0 | $0 |
| 2013 | -- | $97,230 | $0 | $0 |
Source: Public Records
Map
Nearby Homes
- 5790 N 6850 W
- 6953 W 6600 N Unit 3
- 15 S 400 W
- 180 N 300 W
- 144 N 300 W Unit 13
- 141 N 300 W Unit 12
- 165 N 300 W Unit 11
- 172 N 300 W Unit 14
- 140 S 200 E
- 115 N 100 W Unit 23
- 312 W 200 N Unit 10
- 222 W 200 N Unit 18
- 136 W 200 N Unit 21
- 244 W 200 N Unit 17
- 260 W 200 N Unit 16
- 158 W 200 N Unit 20
- 116 W 200 N Unit 22
- 362 W 200 N Unit 8
- 340 W 200 N Unit 9
- 7900 N 5600 W
- 7180 W 5800 N
- 5659 N 7000 W
- 5695 N Highway 23
- 5667 N 7000 W
- 5670 N Highway 23
- 6723 W 5800 N
- 5641 N 7000 W
- 5631 N 7000 W
- 5609 N Highway 23
- 0 11250 West 5600 N
- 6741 W 5600 N
- 6719 W 5600 N
- 6681 W 5600 N
- 6805 W 6200 N
- 6886 W 6200 N
- 6440 N 6900 W
- 6460 N Highway 23
- 6553 N 6900 W
- 6890 W 6600 N Unit 1
- 135 W 6600 N Unit 3
Your Personal Tour Guide
Ask me questions while you tour the home.