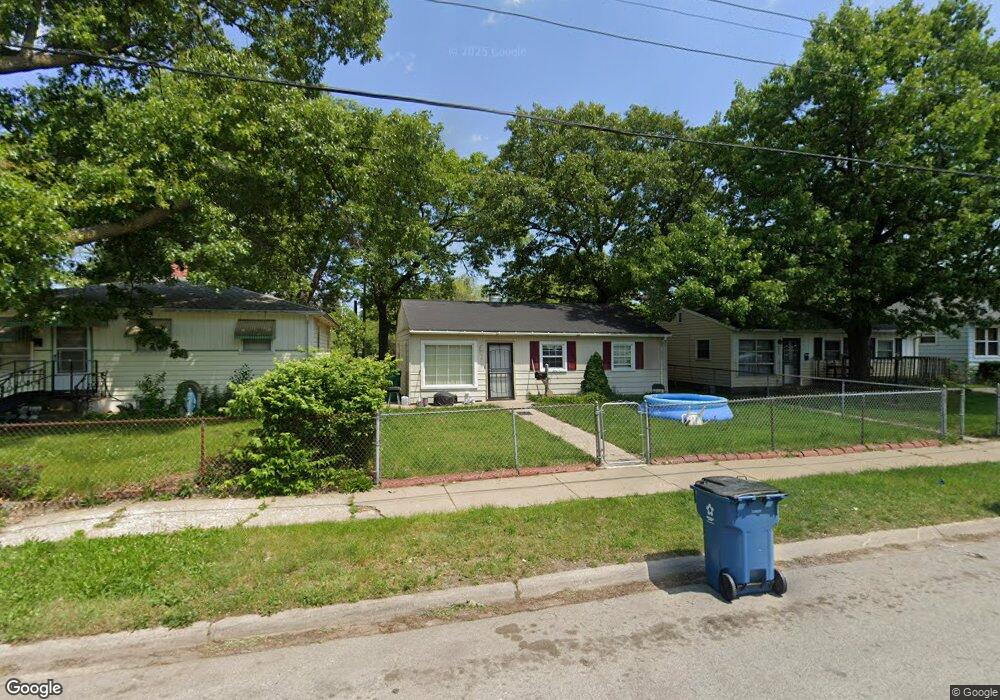
5916 W 9th Ave Gary, IN 46406
Westside NeighborhoodEstimated Value: $65,000 - $82,000
2
Beds
1
Bath
1,650
Sq Ft
$44/Sq Ft
Est. Value
About This Home
This home is located at 5916 W 9th Ave, Gary, IN 46406 and is currently estimated at $72,335, approximately $43 per square foot. 5916 W 9th Ave is a home located in Lake County with nearby schools including Bailly Preparatory Academy, West Side Leadership Academy, and Aspire Charter Academy.
Ownership History
Date
Name
Owned For
Owner Type
Purchase Details
Closed on
Feb 1, 2022
Sold by
Barcan Management Llc
Bought by
Teachout Caleb
Current Estimated Value
Purchase Details
Closed on
Jan 25, 2022
Sold by
Barcan Management Llc
Bought by
Teachout Caleb
Purchase Details
Closed on
Feb 25, 2011
Sold by
Washington Darren L
Bought by
Barcan Management Llc
Create a Home Valuation Report for This Property
The Home Valuation Report is an in-depth analysis detailing your home's value as well as a comparison with similar homes in the area
Home Values in the Area
Average Home Value in this Area
Purchase History
We collect this data history from publicly available records. To have your information removed, we recommend requesting removal directly through your county’s website.
| Date | Buyer | Sale Price | Title Company |
|---|---|---|---|
| Teachout Caleb | -- | Kvachkoff Douglas R | |
| Teachout Caleb | -- | Kvachkoff Douglas R | |
| Barcan Management Llc | -- | None Available |
Source: Public Records
Tax History
| Year | Tax Paid | Tax Assessment Tax Assessment Total Assessment is a certain percentage of the fair market value that is determined by local assessors to be the total taxable value of land and additions on the property. | Land | Improvement |
|---|---|---|---|---|
| 2025 | $1,054 | $46,800 | $8,000 | $38,800 |
| 2024 | $3,474 | $42,500 | $8,300 | $34,200 |
| 2023 | $994 | $39,400 | $8,300 | $31,100 |
| 2022 | $722 | $28,200 | $5,500 | $22,700 |
| 2021 | $674 | $26,300 | $5,500 | $20,800 |
| 2020 | $651 | $25,400 | $5,500 | $19,900 |
| 2019 | $568 | $25,400 | $5,500 | $19,900 |
| 2018 | $599 | $25,400 | $5,500 | $19,900 |
| 2017 | $618 | $25,800 | $5,500 | $20,300 |
| 2016 | $846 | $36,900 | $5,500 | $31,400 |
| 2014 | $908 | $38,800 | $6,300 | $32,500 |
| 2013 | $843 | $37,500 | $6,300 | $31,200 |
Source: Public Records
Map
Nearby Homes
Your Personal Tour Guide
Ask me questions while you tour the home.