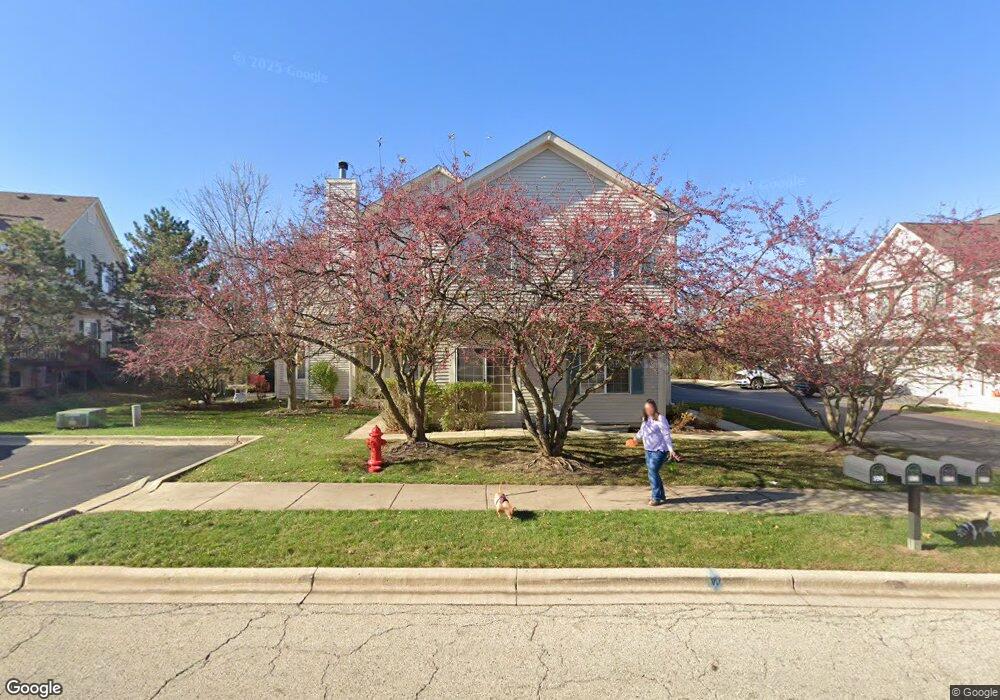
592 Foxridge Dr Unit 28A Fox Lake, IL 60020
Estimated Value: $211,000 - $231,000
Studio
2
Baths
1,188
Sq Ft
$183/Sq Ft
Est. Value
About This Home
This home is located at 592 Foxridge Dr Unit 28A, Fox Lake, IL 60020 and is currently estimated at $217,584, approximately $183 per square foot. 592 Foxridge Dr Unit 28A is a home located in Lake County with nearby schools including Big Hollow Primary School, Big Hollow Elementary School, and Big Hollow Middle School.
Ownership History
Date
Name
Owned For
Owner Type
Purchase Details
Closed on
Sep 6, 2022
Sold by
Braun Eric A and Braun Carrie
Bought by
Frye Stacie J
Current Estimated Value
Home Financials for this Owner
Home Financials are based on the most recent Mortgage that was taken out on this home.
Original Mortgage
$161,405
Outstanding Balance
$154,204
Interest Rate
5.25%
Mortgage Type
New Conventional
Estimated Equity
$63,380
Purchase Details
Closed on
Apr 11, 2005
Sold by
Perez Alfredo and Perez Emma E
Bought by
Braun Eric A
Home Financials for this Owner
Home Financials are based on the most recent Mortgage that was taken out on this home.
Original Mortgage
$155,200
Interest Rate
5.89%
Mortgage Type
FHA
Purchase Details
Closed on
Oct 15, 2001
Sold by
Windsor Development Corp
Bought by
Perez Alfredo and Perez Emma E
Home Financials for this Owner
Home Financials are based on the most recent Mortgage that was taken out on this home.
Original Mortgage
$130,853
Interest Rate
6.64%
Create a Home Valuation Report for This Property
The Home Valuation Report is an in-depth analysis detailing your home's value as well as a comparison with similar homes in the area
Home Values in the Area
Average Home Value in this Area
Purchase History
| Date | Buyer | Sale Price | Title Company |
|---|---|---|---|
| Frye Stacie J | $170,000 | Baird & Warner Title Services | |
| Braun Eric A | $160,000 | Chicago Title Insurance Comp | |
| Perez Alfredo | $135,000 | -- |
Source: Public Records
Mortgage History
| Date | Status | Borrower | Loan Amount |
|---|---|---|---|
| Open | Frye Stacie J | $161,405 | |
| Previous Owner | Braun Eric A | $155,200 | |
| Previous Owner | Perez Alfredo | $130,853 |
Source: Public Records
Tax History
| Year | Tax Paid | Tax Assessment Tax Assessment Total Assessment is a certain percentage of the fair market value that is determined by local assessors to be the total taxable value of land and additions on the property. | Land | Improvement |
|---|---|---|---|---|
| 2024 | $4,353 | $56,925 | $7,752 | $49,173 |
| 2023 | $4,544 | $53,627 | $7,303 | $46,324 |
| 2022 | $4,544 | $49,012 | $4,691 | $44,321 |
| 2021 | $4,082 | $42,166 | $4,422 | $37,744 |
| 2020 | $4,202 | $42,905 | $4,359 | $38,546 |
| 2019 | $4,058 | $41,144 | $4,180 | $36,964 |
| 2018 | $3,128 | $31,940 | $4,289 | $27,651 |
| 2017 | $3,060 | $29,522 | $3,964 | $25,558 |
| 2016 | $3,104 | $27,000 | $3,625 | $23,375 |
| 2015 | $2,254 | $25,196 | $3,383 | $21,813 |
| 2014 | $1,845 | $21,588 | $3,229 | $18,359 |
| 2012 | $2,896 | $22,497 | $3,366 | $19,131 |
Source: Public Records
Map
Nearby Homes
- 35403 N 2nd Ave
- 35828 N Marine Dr
- 27668 W Luana Ln
- 515 Park Ave
- 306 Woodlock St
- 61 Highview Ave
- 54 Hillcrest Ave
- 532 Circle Dr
- 29 Elm Ave
- 15 Ridgeland Ave
- 10 S Maple Ave
- 35769 N Cedar Island
- 176 E Grand Ave
- 21 Hillside Dr
- 127 E Grand Ave
- 200 Hollow Way
- 111 Manor Ave
- 35 Medinah Ave
- 35359 N Donald Ct
- 605 Rollins Rd
- 592 Fox Ridge Dr Unit 592
- 590 Foxridge Dr Unit 27D
- 584 Foxridge Dr Unit 27A
- 598 Foxridge Dr Unit 28D
- 596 Foxridge Dr Unit 28C
- 594 Foxridge Dr Unit B
- 590 Foxridge Dr Unit 590
- 584 Foxridge Dr Unit A
- 594 Foxridge Dr Unit 28B
- 590 Fox Ridge Dr
- 602 Foxridge Dr Unit 29B
- 586 Fox Ridge Dr
- 586 Fox Ridge Dr Unit B
- 588 Foxridge Dr Unit C
- 604 Foxridge Dr Unit C
- 600 Foxridge Dr Unit 29A
- 586 Foxridge Dr Unit 27B
- 606 Foxridge Dr Unit 29D
- 587 Foxridge Dr Unit 35A
- 599 Foxridge Dr Unit 34C
Your Personal Tour Guide
Ask me questions while you tour the home.