593 Mazur Ave Paramus, NJ 07652
Estimated Value: $1,006,137 - $1,165,000
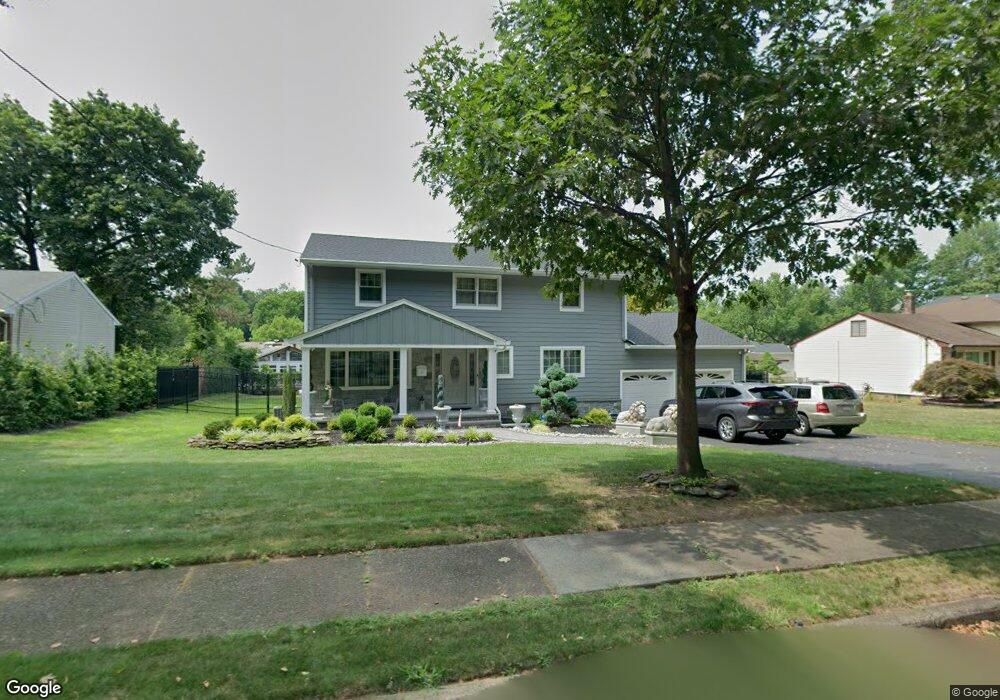
About This Home
This home is located at 593 Mazur Ave, Paramus, NJ 07652 and is currently estimated at $1,097,034, approximately $502 per square foot. 593 Mazur Ave is a home located in Bergen County with nearby schools including Paramus High School, Alpine Learning Group, and Paramus Catholic High School.
Ownership History
We collect this data history from publicly available records. To have your information removed, we recommend requesting removal directly through your county’s website.
Purchase Details
Purchase Details
Home Financials for this Owner
Home Financials are based on the most recent Mortgage that was taken out on this home.Home Values in the Area
Average Home Value in this Area
Purchase History
We collect this data history from publicly available records. To have your information removed, we recommend requesting removal directly through your county’s website.
| Date | Buyer | Sale Price | Title Company |
|---|---|---|---|
| -- | Stewart Title Guaranty Compa | ||
| $580,000 | Stewart Title Guaranty Co |
Mortgage History
We collect this data history from publicly available records. To have your information removed, we recommend requesting removal directly through your county’s website.
| Date | Status | Borrower | Loan Amount |
|---|---|---|---|
| Open | $380,000 |
Tax History
We collect this data history from publicly available records. To have your information removed, we recommend requesting removal directly through your county’s website.
| Year | Tax Paid | Tax Assessment Tax Assessment Total Assessment is a certain percentage of the fair market value that is determined by local assessors to be the total taxable value of land and additions on the property. | Land | Improvement |
|---|---|---|---|---|
| 2025 | $10,571 | $773,200 | $442,900 | $330,300 |
| 2024 | $10,399 | $698,200 | $382,400 | $315,800 |
| 2023 | $9,878 | $677,900 | $364,600 | $313,300 |
| 2022 | $9,878 | $636,500 | $340,500 | $296,000 |
| 2021 | $9,648 | $583,300 | $310,000 | $273,300 |
| 2020 | $9,337 | $585,400 | $315,000 | $270,400 |
| 2019 | $9,659 | $520,400 | $302,500 | $217,900 |
| 2018 | $9,539 | $520,400 | $302,500 | $217,900 |
| 2017 | $9,327 | $517,900 | $302,500 | $215,400 |
| 2016 | $9,074 | $517,900 | $302,500 | $215,400 |
| 2015 | $8,980 | $517,900 | $302,500 | $215,400 |
| 2014 | $8,653 | $517,900 | $302,500 | $215,400 |
Map
- 27 Feldman Ct
- 720 Maxwell Place
- 266 Central Ave
- 671 Delaware Ave
- 538 Coolidge Place
- 305 Blauvelt Ct
- 495 Paramus Rd
- 683 Victoria Ave
- 321 Kenilworth Rd
- 648 Falmouth Ave
- 254 Hoppers Ln
- 488 Dorchester Rd
- 642 Ellington Rd
- 22 Kendrick St
- 474 Stevens Ave
- 82 Azalea St
- 38 W Ridgewood Ave
- 116 Kenilworth Rd
- 512 Spring Ave
- 177 Truman Terrace
Ask me questions while you tour the home.