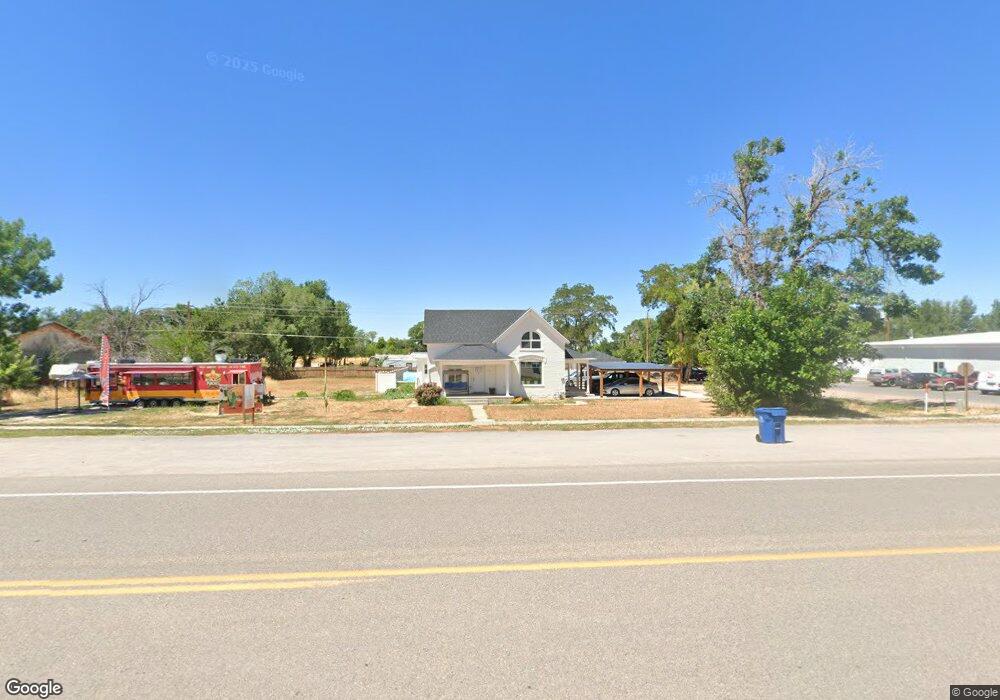
595 N Main St Fillmore, UT 84631
Estimated Value: $374,000 - $433,000
4
Beds
3
Baths
2,681
Sq Ft
$151/Sq Ft
Est. Value
About This Home
This home is located at 595 N Main St, Fillmore, UT 84631 and is currently estimated at $404,529, approximately $150 per square foot. 595 N Main St is a home located in Millard County.
Ownership History
Date
Name
Owned For
Owner Type
Purchase Details
Closed on
Dec 17, 2019
Sold by
Monsen Joshua T and Bird Asia
Bought by
Ortiz Salvador Sanchez
Current Estimated Value
Home Financials for this Owner
Home Financials are based on the most recent Mortgage that was taken out on this home.
Original Mortgage
$218,968
Outstanding Balance
$192,635
Interest Rate
3.6%
Mortgage Type
New Conventional
Estimated Equity
$211,894
Purchase Details
Closed on
Nov 19, 2018
Sold by
Rna Investments Llc
Bought by
Monsen Jashua T and Bird Asia
Purchase Details
Closed on
Jun 5, 2018
Sold by
Bracken Leo Spencer
Bought by
Rna Investments Llc
Purchase Details
Closed on
Nov 10, 2008
Sold by
Etitle Insurance Agency
Bought by
Bracken Leo Spencer
Purchase Details
Closed on
Nov 9, 2005
Sold by
Anderson Doris E
Bought by
Musser Bonnie J
Home Financials for this Owner
Home Financials are based on the most recent Mortgage that was taken out on this home.
Original Mortgage
$64,000
Interest Rate
5.97%
Mortgage Type
New Conventional
Create a Home Valuation Report for This Property
The Home Valuation Report is an in-depth analysis detailing your home's value as well as a comparison with similar homes in the area
Home Values in the Area
Average Home Value in this Area
Purchase History
| Date | Buyer | Sale Price | Title Company |
|---|---|---|---|
| Ortiz Salvador Sanchez | -- | First American Title | |
| Monsen Jashua T | -- | -- | |
| Rna Investments Llc | -- | First American Title | |
| Bracken Leo Spencer | $67,503 | -- | |
| Musser Bonnie J | -- | -- | |
| Anderson Doris E | -- | First American Title Insuran |
Source: Public Records
Mortgage History
| Date | Status | Borrower | Loan Amount |
|---|---|---|---|
| Open | Ortiz Salvador Sanchez | $218,968 | |
| Previous Owner | Musser Bonnie J | $64,000 |
Source: Public Records
Tax History
| Year | Tax Paid | Tax Assessment Tax Assessment Total Assessment is a certain percentage of the fair market value that is determined by local assessors to be the total taxable value of land and additions on the property. | Land | Improvement |
|---|---|---|---|---|
| 2025 | $1,817 | $228,251 | $33,086 | $195,165 |
| 2024 | $1,817 | $169,823 | $25,596 | $144,227 |
| 2023 | $1,833 | $169,823 | $25,596 | $144,227 |
| 2022 | $1,627 | $146,130 | $23,269 | $122,861 |
| 2021 | $1,431 | $123,345 | $15,110 | $108,235 |
| 2020 | $1,326 | $114,950 | $13,736 | $101,214 |
| 2019 | $982 | $85,382 | $13,736 | $71,646 |
| 2018 | $622 | $55,334 | $24,975 | $30,359 |
| 2017 | $1,213 | $102,688 | $24,975 | $77,713 |
| 2016 | $1,160 | $102,688 | $24,975 | $77,713 |
| 2015 | $1,161 | $102,688 | $24,975 | $77,713 |
| 2014 | -- | $102,688 | $24,975 | $77,713 |
| 2013 | -- | $102,688 | $24,975 | $77,713 |
Source: Public Records
Map
Nearby Homes
- 390 N 100 W
- 335 W 400 North St
- 245 W 300 N
- 225 W 200 St N
- 75 N 100 West St
- 2155 N Cedar Mountain Rd
- 2835 N Cedar Mountain Rd
- 155 W Center St
- 410 W 400 N
- 40 S 100 Rd E
- 351 W 100 South St
- 260 W 200 S
- 220 S 200 E
- 310 S 500 West Rd
- 465 S 100 W
- 155 E 500 St S
- 157 E 500 South St
- 405 E 500 St S
- 690 E 500 S
- 750 800 South Fillmore
Your Personal Tour Guide
Ask me questions while you tour the home.