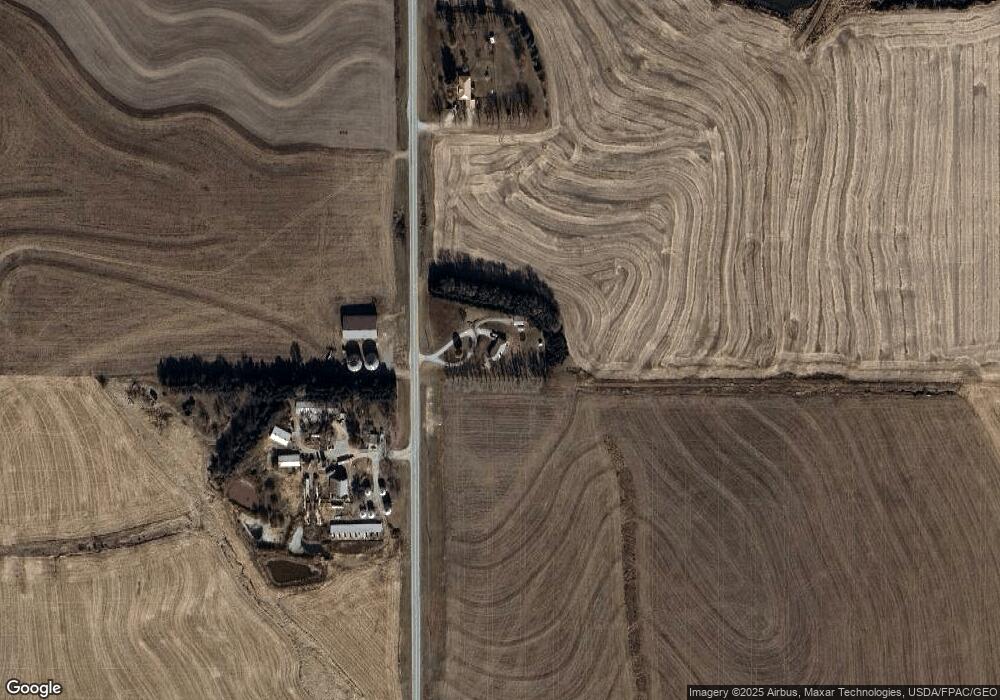
595 S 46th Rd Dunbar, NE 68346
Estimated Value: $345,000 - $420,000
4
Beds
3
Baths
1,232
Sq Ft
$307/Sq Ft
Est. Value
About This Home
This home is located at 595 S 46th Rd, Dunbar, NE 68346 and is currently estimated at $377,734, approximately $306 per square foot. 595 S 46th Rd is a home located in Otoe County with nearby schools including Elementary School at Syracuse and High School at Syracuse.
Ownership History
Date
Name
Owned For
Owner Type
Purchase Details
Closed on
Oct 25, 2021
Sold by
Bassinger Jimmie W and Bassinger Susan L
Bought by
Fries Michael L and Fries Lynette M
Current Estimated Value
Home Financials for this Owner
Home Financials are based on the most recent Mortgage that was taken out on this home.
Original Mortgage
$249,000
Outstanding Balance
$224,587
Interest Rate
2.8%
Mortgage Type
New Conventional
Estimated Equity
$153,147
Create a Home Valuation Report for This Property
The Home Valuation Report is an in-depth analysis detailing your home's value as well as a comparison with similar homes in the area
Purchase History
| Date | Buyer | Sale Price | Title Company |
|---|---|---|---|
| Fries Michael L | $269,000 | Home Services Title |
Source: Public Records
Mortgage History
| Date | Status | Borrower | Loan Amount |
|---|---|---|---|
| Open | Fries Michael L | $249,000 |
Source: Public Records
Tax History
| Year | Tax Paid | Tax Assessment Tax Assessment Total Assessment is a certain percentage of the fair market value that is determined by local assessors to be the total taxable value of land and additions on the property. | Land | Improvement |
|---|---|---|---|---|
| 2025 | $2,994 | $339,444 | $38,225 | $301,219 |
| 2024 | $4,804 | $339,444 | $38,225 | $301,219 |
| 2023 | $4,804 | $335,463 | $34,750 | $300,713 |
| 2022 | $3,566 | $250,991 | $34,750 | $216,241 |
| 2021 | $2,703 | $196,240 | $34,750 | $161,490 |
| 2020 | $2,730 | $194,240 | $32,750 | $161,490 |
| 2019 | $2,558 | $179,560 | $32,750 | $146,810 |
| 2018 | $2,351 | $175,560 | $28,750 | $146,810 |
| 2017 | $2,267 | $175,560 | $28,750 | $146,810 |
| 2016 | $2,455 | $190,350 | $28,750 | $161,600 |
| 2015 | $2,480 | $190,350 | $28,750 | $161,600 |
| 2014 | $2,676 | $189,240 | $27,640 | $161,600 |
| 2012 | $2,691 | $186,730 | $25,130 | $161,600 |
Source: Public Records
Map
Nearby Homes
Your Personal Tour Guide
Ask me questions while you tour the home.