Estimated Value: $203,000 - $569,000
Studio
--
Bath
2,288
Sq Ft
$176/Sq Ft
Est. Value
About This Home
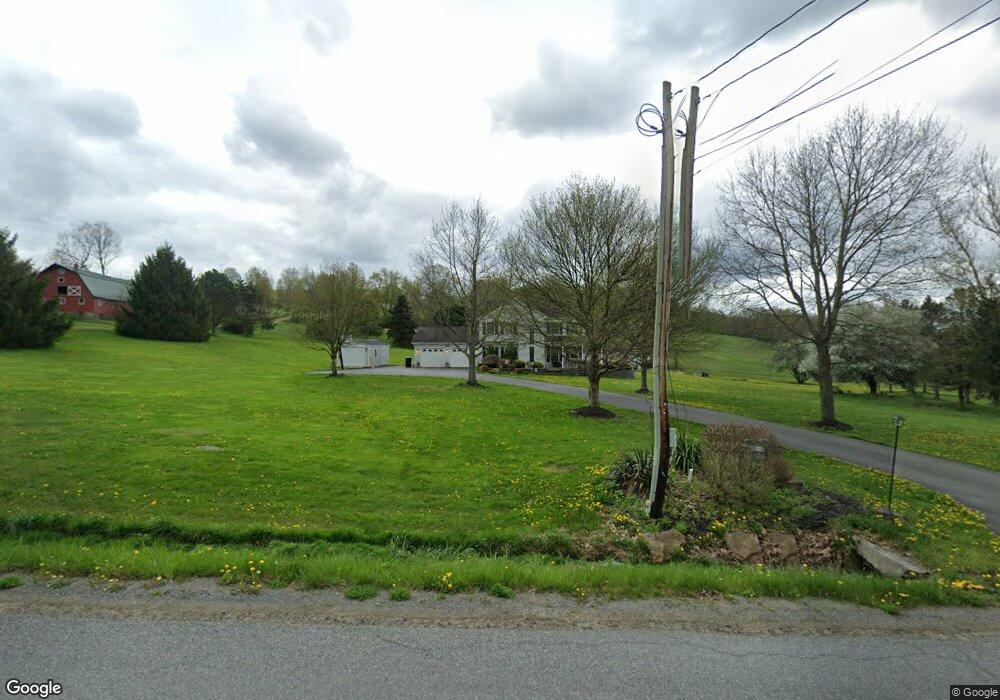
This home is located at 596 Jo jo Rd, Kane, PA 16735 and is currently estimated at $403,019, approximately $176 per square foot. 596 Jo jo Rd is a home located in McKean County with nearby schools including Kane Area Elementary School, Kane Area Middle School, and Kane Area High School.
Ownership History
Date
Name
Owned For
Owner Type
Purchase Details
Closed on
Jan 30, 2023
Sold by
Paup Sonya
Bought by
Desio Stephanie J
Current Estimated Value
Home Financials for this Owner
Home Financials are based on the most recent Mortgage that was taken out on this home.
Original Mortgage
$133,000
Outstanding Balance
$117,360
Interest Rate
5.69%
Mortgage Type
New Conventional
Estimated Equity
$285,659
Purchase Details
Closed on
Aug 26, 2016
Sold by
Paup Mark A and Paup Sonya
Bought by
Paup Sonya
Home Financials for this Owner
Home Financials are based on the most recent Mortgage that was taken out on this home.
Original Mortgage
$100,000
Interest Rate
3.45%
Mortgage Type
Credit Line Revolving
Create a Home Valuation Report for This Property
The Home Valuation Report is an in-depth analysis detailing your home's value as well as a comparison with similar homes in the area
Purchase History
| Date | Buyer | Sale Price | Title Company |
|---|---|---|---|
| Desio Stephanie J | -- | -- | |
| Paup Sonya | -- | None Available |
Source: Public Records
Mortgage History
| Date | Status | Borrower | Loan Amount |
|---|---|---|---|
| Open | Desio Stephanie J | $133,000 | |
| Previous Owner | Paup Sonya | $100,000 |
Source: Public Records
Tax History
| Year | Tax Paid | Tax Assessment Tax Assessment Total Assessment is a certain percentage of the fair market value that is determined by local assessors to be the total taxable value of land and additions on the property. | Land | Improvement |
|---|---|---|---|---|
| 2025 | $4,984 | $156,400 | $12,770 | $143,630 |
| 2024 | $4,789 | $156,400 | $12,770 | $143,630 |
| 2023 | $4,789 | $156,400 | $12,770 | $143,630 |
| 2022 | $4,789 | $156,400 | $12,770 | $143,630 |
| 2021 | $4,789 | $156,400 | $12,770 | $143,630 |
| 2020 | $4,789 | $156,400 | $12,770 | $143,630 |
| 2019 | $4,633 | $156,400 | $12,770 | $143,630 |
| 2018 | $46 | $156,400 | $12,770 | $143,630 |
| 2017 | -- | $156,400 | $12,770 | $143,630 |
| 2016 | $4,256 | $156,400 | $12,770 | $143,630 |
| 2015 | $1,470 | $156,400 | $12,770 | $143,630 |
| 2014 | $1,470 | $156,400 | $12,770 | $143,630 |
Source: Public Records
Map
Nearby Homes
Your Personal Tour Guide
Ask me questions while you tour the home.