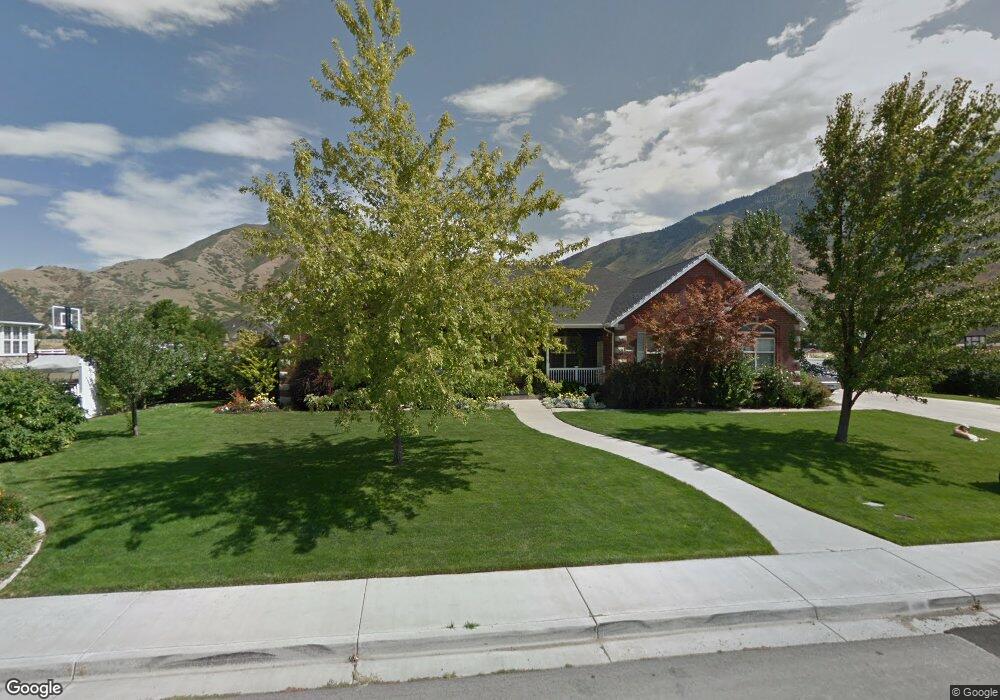
598 N 1000 E Mapleton, UT 84664
Estimated Value: $779,000 - $988,861
4
Beds
2
Baths
2,185
Sq Ft
$405/Sq Ft
Est. Value
About This Home
This home is located at 598 N 1000 E, Mapleton, UT 84664 and is currently estimated at $884,215, approximately $404 per square foot. 598 N 1000 E is a home located in Utah County with nearby schools including Hobble Creek School, Mapleton Junior High School, and Maple Mountain High School.
Ownership History
Date
Name
Owned For
Owner Type
Purchase Details
Closed on
Oct 22, 1999
Sold by
Black Lance Eli and Black Michelle B
Bought by
Black Michelle B
Current Estimated Value
Purchase Details
Closed on
Apr 30, 1999
Sold by
Maple Development Corp
Bought by
Black Lance Eli and Black Michelle B
Home Financials for this Owner
Home Financials are based on the most recent Mortgage that was taken out on this home.
Original Mortgage
$210,000
Outstanding Balance
$53,991
Interest Rate
6.98%
Estimated Equity
$830,225
Create a Home Valuation Report for This Property
The Home Valuation Report is an in-depth analysis detailing your home's value as well as a comparison with similar homes in the area
Home Values in the Area
Average Home Value in this Area
Purchase History
| Date | Buyer | Sale Price | Title Company |
|---|---|---|---|
| Black Michelle B | -- | First American Title Co | |
| Black Lance Eli | -- | Old Republic Title Company |
Source: Public Records
Mortgage History
| Date | Status | Borrower | Loan Amount |
|---|---|---|---|
| Open | Black Lance Eli | $210,000 |
Source: Public Records
Tax History
| Year | Tax Paid | Tax Assessment Tax Assessment Total Assessment is a certain percentage of the fair market value that is determined by local assessors to be the total taxable value of land and additions on the property. | Land | Improvement |
|---|---|---|---|---|
| 2025 | $4,910 | $462,550 | -- | -- |
| 2024 | $4,910 | $480,975 | $0 | $0 |
| 2023 | $5,205 | $513,150 | $0 | $0 |
| 2022 | $6,048 | $589,545 | $0 | $0 |
| 2021 | $4,971 | $743,900 | $299,600 | $444,300 |
| 2020 | $4,885 | $707,200 | $280,000 | $427,200 |
| 2019 | $4,752 | $702,200 | $275,000 | $427,200 |
| 2018 | $4,237 | $596,000 | $240,000 | $356,000 |
| 2017 | $3,976 | $296,780 | $0 | $0 |
| 2016 | $3,851 | $285,780 | $0 | $0 |
| 2015 | $3,499 | $258,060 | $0 | $0 |
| 2014 | -- | $230,560 | $0 | $0 |
Source: Public Records
Map
Nearby Homes
- 775 N 800 E
- 310 N 800 E
- 162 N 800 E
- 1096 N 1000 E
- 594 E 1000 N
- 1377 E Maple St
- 745 E Maple St
- 141 N 600 E
- 435 E 1000 N
- 265 E 600 N
- 1515 E Maple St
- 415 E Maple St
- 630 N 1600 E
- 1548 N 1350 St E Unit 11
- 1578 N 1350 St E Unit 12
- 1447 N 1350 St E Unit 5
- 1577 N 1350 St E Unit 1
- 1477 N 1350 St E Unit 4
- 1547 N 1350 St E Unit 2
- 1511 N 1350 St E Unit 3
Your Personal Tour Guide
Ask me questions while you tour the home.