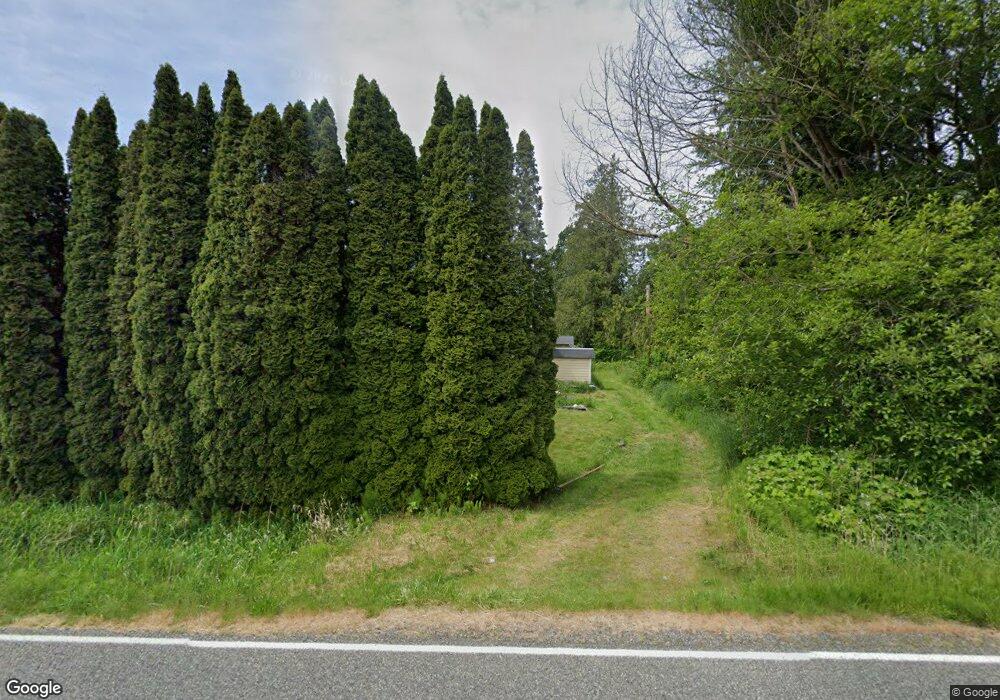
5999 Old Guide Rd Bellingham, WA 98226
Estimated Value: $646,000 - $835,000
4
Beds
2
Baths
2,180
Sq Ft
$335/Sq Ft
Est. Value
About This Home
This home is located at 5999 Old Guide Rd, Bellingham, WA 98226 and is currently estimated at $729,983, approximately $334 per square foot. 5999 Old Guide Rd is a home located in Whatcom County with nearby schools including Irene Reither Elementary School, Meridian Middle School, and Meridian High School.
Ownership History
Date
Name
Owned For
Owner Type
Purchase Details
Closed on
Dec 21, 2005
Sold by
Stager Kristy L
Bought by
Stager Krista L
Current Estimated Value
Home Financials for this Owner
Home Financials are based on the most recent Mortgage that was taken out on this home.
Original Mortgage
$182,500
Outstanding Balance
$112,065
Interest Rate
8.3%
Mortgage Type
Fannie Mae Freddie Mac
Estimated Equity
$617,918
Purchase Details
Closed on
Jun 3, 2002
Sold by
Taylor Brock H and Taylor Cydney L
Bought by
Stager William R and Stager Kristy L
Home Financials for this Owner
Home Financials are based on the most recent Mortgage that was taken out on this home.
Original Mortgage
$144,637
Interest Rate
6.89%
Mortgage Type
FHA
Create a Home Valuation Report for This Property
The Home Valuation Report is an in-depth analysis detailing your home's value as well as a comparison with similar homes in the area
Purchase History
| Date | Buyer | Sale Price | Title Company |
|---|---|---|---|
| Stager Krista L | -- | Stewart Title Company | |
| Stager William R | $128,932 | Whatcom Land Title |
Source: Public Records
Mortgage History
| Date | Status | Borrower | Loan Amount |
|---|---|---|---|
| Open | Stager Krista L | $182,500 | |
| Previous Owner | Stager William R | $144,637 |
Source: Public Records
Tax History
| Year | Tax Paid | Tax Assessment Tax Assessment Total Assessment is a certain percentage of the fair market value that is determined by local assessors to be the total taxable value of land and additions on the property. | Land | Improvement |
|---|---|---|---|---|
| 2025 | $5,500 | $646,693 | $335,450 | $311,243 |
| 2024 | $4,839 | $624,747 | $313,504 | $311,243 |
| 2023 | $4,839 | $622,472 | $323,200 | $299,272 |
| 2022 | $4,262 | $535,077 | $222,084 | $312,993 |
| 2021 | $4,125 | $424,664 | $176,257 | $248,407 |
| 2020 | $3,624 | $375,805 | $155,978 | $219,827 |
| 2019 | $2,979 | $331,107 | $137,426 | $193,681 |
| 2018 | $3,466 | $297,631 | $123,532 | $174,099 |
| 2017 | $3,418 | $263,390 | $109,320 | $154,070 |
| 2016 | $3,328 | $275,077 | $123,909 | $151,168 |
| 2015 | $3,133 | $266,648 | $120,112 | $146,536 |
| 2014 | -- | $243,381 | $109,632 | $133,749 |
| 2013 | -- | $237,532 | $106,997 | $130,535 |
Source: Public Records
Map
Nearby Homes
- 6037 Old Guide Rd
- 490 W Laurel Rd
- 351 W Silverado Ct
- 353 E Silverado Ct
- 411 E Axton Rd
- 0 Old Guide Rd
- 186 W Smith Rd
- 0 W Axton Rd
- 205 E Smith Rd
- 693 Shultz Dr
- 794 W Smith Rd
- 720 Denali Ct
- 725 Denali Ct
- 731 Denali Ct
- 740 Denali Ct
- 739 Denali Ct
- 5707 Denali Ln
- 5747 Denali Ln
- 5700 Denali Ln
- 504 E Smith Rd
- 5959 Old Guide Rd
- 349 W Hemmi Rd
- 6022 Old Guide Rd
- 373 W Hemmi Rd
- 6040 Old Guide Rd
- 6054 Old Guide Rd
- 5950 Old Guide Rd
- 6066 Old Guide Rd
- 6018 Old Guide Rd
- 6074 Old Guide Rd
- 375 W Hemmi Rd
- 6082 Old Guide Rd
- 239 W Hemmi Rd
- 221 W Hemmi Rd
- 203 W Hemmi Rd
- 376 W Hemmi Rd
- 413 W Hemmi Rd
- 255 W Laurel Rd
- 317 W Laurel Rd
Your Personal Tour Guide
Ask me questions while you tour the home.