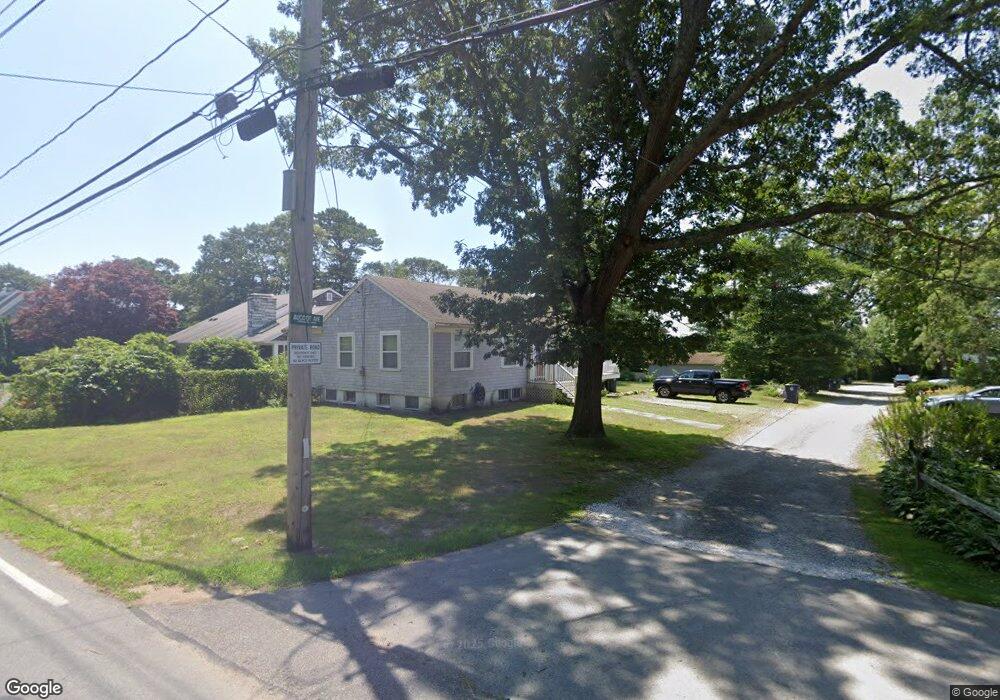
6 Aucoot Ave Marion, MA 02738
Estimated Value: $694,431 - $811,000
2
Beds
2
Baths
1,563
Sq Ft
$478/Sq Ft
Est. Value
About This Home
This home is located at 6 Aucoot Ave, Marion, MA 02738 and is currently estimated at $746,858, approximately $477 per square foot. 6 Aucoot Ave is a home located in Plymouth County with nearby schools including Old Rochester Regional High School and Tabor Academy.
Ownership History
Date
Name
Owned For
Owner Type
Purchase Details
Closed on
Feb 20, 2025
Sold by
Mcdavid Keith and Mcdavid Kristina
Bought by
Mcdavid Lt and Mcdavid
Current Estimated Value
Purchase Details
Closed on
Nov 2, 1999
Sold by
Lima Carolyn H
Bought by
Mcdavid Keith and Mcdavid Kristina
Create a Home Valuation Report for This Property
The Home Valuation Report is an in-depth analysis detailing your home's value as well as a comparison with similar homes in the area
Purchase History
| Date | Buyer | Sale Price | Title Company |
|---|---|---|---|
| Mcdavid Lt | -- | None Available | |
| Mcdavid Lt | -- | None Available | |
| Mcdavid Keith | $224,000 | -- | |
| Mcdavid Keith | $224,000 | -- |
Source: Public Records
Mortgage History
| Date | Status | Borrower | Loan Amount |
|---|---|---|---|
| Previous Owner | Mcdavid Keith | $229,834 | |
| Previous Owner | Mcdavid Keith | $100,000 |
Source: Public Records
Tax History
| Year | Tax Paid | Tax Assessment Tax Assessment Total Assessment is a certain percentage of the fair market value that is determined by local assessors to be the total taxable value of land and additions on the property. | Land | Improvement |
|---|---|---|---|---|
| 2025 | $5,912 | $634,300 | $344,900 | $289,400 |
| 2024 | $6,642 | $717,300 | $472,200 | $245,100 |
| 2023 | $4,978 | $527,300 | $297,700 | $229,600 |
| 2022 | $5,809 | $535,400 | $276,400 | $259,000 |
| 2021 | $26,928 | $476,600 | $229,700 | $246,900 |
| 2020 | $5,189 | $443,500 | $229,700 | $213,800 |
| 2019 | $5,097 | $462,100 | $248,300 | $213,800 |
| 2018 | $28,063 | $383,300 | $188,500 | $194,800 |
| 2017 | $4,373 | $383,300 | $188,500 | $194,800 |
| 2016 | $4,251 | $375,900 | $188,500 | $187,400 |
| 2015 | $4,065 | $365,900 | $159,800 | $206,100 |
Source: Public Records
Map
Nearby Homes
Your Personal Tour Guide
Ask me questions while you tour the home.