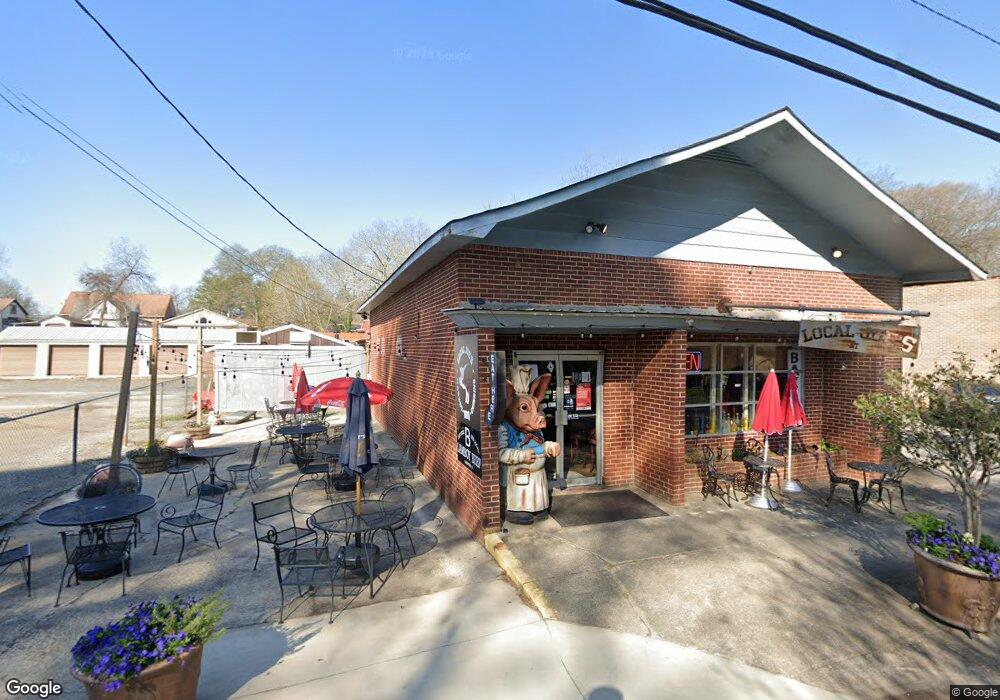
6 Broad St Cave Spring, GA 30124
Studio
--
Bath
1,344
Sq Ft
--
Built
About This Home
This home is located at 6 Broad St, Cave Spring, GA 30124. 6 Broad St is a home located in Floyd County with nearby schools including Coosa Middle School and Coosa High School.
Ownership History
Date
Name
Owned For
Owner Type
Purchase Details
Closed on
Dec 3, 2014
Sold by
Barrett Reece
Bought by
Black Ina Benton
Purchase Details
Closed on
Sep 4, 2008
Sold by
Not Provided
Bought by
Barrett Reece
Purchase Details
Closed on
Aug 7, 2008
Sold by
Not Provided
Bought by
Barrett Reece
Purchase Details
Closed on
Aug 24, 2006
Sold by
Not Provided
Bought by
Barrett Reece
Purchase Details
Closed on
Mar 8, 2001
Sold by
Crowe Doris Mcdonald
Bought by
Dundervill Nora
Purchase Details
Closed on
Feb 1, 2001
Bought by
P and R
Purchase Details
Closed on
Oct 15, 1997
Sold by
Crowe Louie Allen
Bought by
Crowe Doris Mcdonald
Purchase Details
Closed on
Oct 31, 1996
Sold by
Crowe Doris Isbell and Louie Allen Crowe
Bought by
Crowe Louie Allen
Purchase Details
Closed on
Oct 1, 1993
Sold by
Williams Charles S
Bought by
Crowe Doris Isbell and Louie Allen Cr
Purchase Details
Closed on
Sep 17, 1990
Sold by
Lindsey Annie Ruth
Bought by
Williams Charles S
Purchase Details
Closed on
Jan 2, 1971
Sold by
Dewell L Lindsey Trustee Int
Bought by
Lindsey Annie Ruth
Purchase Details
Closed on
Jan 1, 1959
Bought by
Lindsey J D Est
Create a Home Valuation Report for This Property
The Home Valuation Report is an in-depth analysis detailing your home's value as well as a comparison with similar homes in the area
Purchase History
| Date | Buyer | Sale Price | Title Company |
|---|---|---|---|
| Black Ina Benton | $105,000 | -- | |
| Barrett Reece | $48,500 | -- | |
| Barrett Reece | $48,500 | -- | |
| Barrett Reece | -- | -- | |
| Barrett Reece | $58,000 | -- | |
| Dundervill Nora | $58,000 | -- | |
| P | -- | -- | |
| Crowe Doris Mcdonald | -- | -- | |
| Crowe Louie Allen | -- | -- | |
| Crowe Doris Isbell | $26,000 | -- | |
| Williams Charles S | -- | -- | |
| Lindsey Annie Ruth | -- | -- | |
| Lindsey J D Est | -- | -- |
Source: Public Records
Tax History
| Year | Tax Paid | Tax Assessment Tax Assessment Total Assessment is a certain percentage of the fair market value that is determined by local assessors to be the total taxable value of land and additions on the property. | Land | Improvement |
|---|---|---|---|---|
| 2025 | $769 | $29,200 | $12,228 | $16,972 |
| 2024 | $769 | $29,180 | $12,228 | $16,952 |
| 2023 | $768 | $25,472 | $12,228 | $13,244 |
| 2022 | $634 | $23,185 | $11,116 | $12,069 |
| 2021 | $550 | $19,724 | $11,116 | $8,608 |
| 2020 | $555 | $19,731 | $11,116 | $8,615 |
| 2019 | $538 | $19,398 | $11,116 | $8,282 |
| 2018 | $544 | $19,599 | $11,116 | $8,483 |
| 2017 | $557 | $19,996 | $11,116 | $8,880 |
| 2016 | $568 | $20,148 | $11,080 | $9,068 |
| 2015 | $606 | $20,352 | $11,080 | $9,272 |
| 2014 | $606 | $22,020 | $11,080 | $10,940 |
Source: Public Records
Map
Nearby Homes
- 38 Alabama St
- 57 Mill St
- 0 Mill St SW Unit 11671446
- 0 Mill Rd Unit 10629874
- 0 Mill Rd Unit 7670319
- 5598 Fosters Mill Rd
- 700 Gadsden Rd SW
- 0 Melson Rd SW Unit 7676052
- 0 Melson Rd SW Unit 10636997
- 907 Gadsden Rd SW
- 7112 C Blacks Bluff Rd
- 475 Davis Rd SW
- 5981 Blacks Bluff Rd SW
- 0 Santa Claus Rd Unit 7735787
- 0 Santa Claus Rd Unit 7706526
- 0 Santa Claus Rd Unit 10676218
- 914 Chubbtown Rd
- 1590 Buttermilk Rd SW
- 75 Weaver Rd
- 612 Michael Blvd
- 10 Broad St
- 5 River St SW
- 16 Alabama St
- 7 River St SW
- 3 River St SW
- 1 Rome Rd SW
- 26 Alabama St
- 10 Alabama St
- 22 Alabama St
- 0 Highway 411
- 28 Alabama St
- 4 River St SW
- 25 Alabama St
- 8 River St SW
- 20 Broad St
- 8.09 Acres On Cut Log Road Tract 7
- 5.06 Acres On Cut Log Road Tract 11
- 5.174 Acres On Cut Log Road Tract 13
- 5 Alabama St
- 1 Church St
Your Personal Tour Guide
Ask me questions while you tour the home.