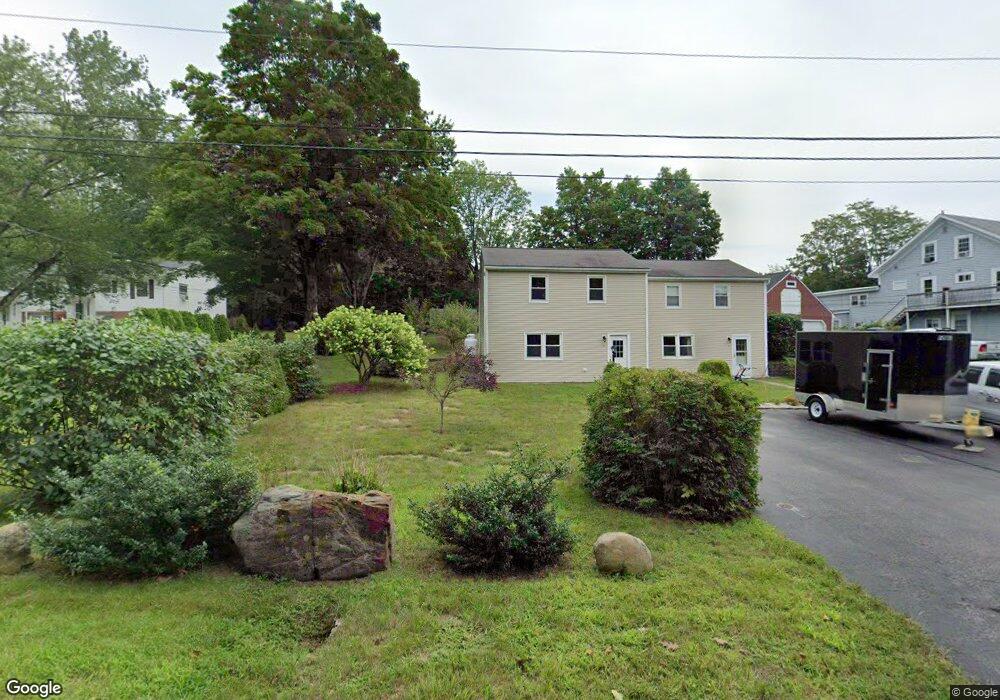
6 Cedar Ln Berwick, ME 03901
Estimated Value: $420,000 - $529,000
5
Beds
3
Baths
2,194
Sq Ft
$206/Sq Ft
Est. Value
About This Home
Make this NEWLY RENOVATED & well cared for duplex unit your next home!!
BERWICK - UPDATED 3 Bedroom Duplex outside of town
6 Cedar Lane, Berwick - some maps have this wrong, so give us a call!
Included: Water/Sewer, Lawn Care
Features:
Eat-in kitchen
Carpet
Hardwood
Storage Space
Ceiling Fans
Refrigerator
Stove/ Oven
Dishwasher
Washer and Dryer in unit for private use
Private Patio
Yard / Lawn
Garden
Shed
2 Car Off-Street Parking
Near Public Transportation
Sorry, No Pets
Non Smoking Premises
Create a Home Valuation Report for This Property
The Home Valuation Report is an in-depth analysis detailing your home's value as well as a comparison with similar homes in the area
Home Values in the Area
Average Home Value in this Area
Property History
| Date | Event | Price | List to Sale | Price per Sq Ft |
|---|---|---|---|---|
| 05/12/2025 05/12/25 | Off Market | $2,150 | -- | -- |
| 03/26/2025 03/26/25 | For Rent | $2,150 | 0.0% | -- |
| 03/23/2025 03/23/25 | Off Market | $2,150 | -- | -- |
| 02/18/2025 02/18/25 | For Rent | $2,150 | 0.0% | -- |
| 02/12/2025 02/12/25 | Off Market | $2,150 | -- | -- |
| 02/10/2025 02/10/25 | Off Market | -- | -- | -- |
| 01/10/2025 01/10/25 | For Rent | -- | -- | -- |
| 01/10/2025 01/10/25 | For Rent | $2,150 | 0.0% | -- |
| 01/09/2025 01/09/25 | For Rent | $2,150 | -- | -- |
Tax History
| Year | Tax Paid | Tax Assessment Tax Assessment Total Assessment is a certain percentage of the fair market value that is determined by local assessors to be the total taxable value of land and additions on the property. | Land | Improvement |
|---|---|---|---|---|
| 2025 | $4,870 | $373,500 | $93,400 | $280,100 |
| 2024 | $4,658 | $373,500 | $93,400 | $280,100 |
| 2023 | $4,800 | $262,000 | $66,700 | $195,300 |
| 2022 | $4,774 | $262,000 | $66,700 | $195,300 |
| 2021 | $4,337 | $262,000 | $66,700 | $195,300 |
| 2020 | $4,242 | $262,000 | $66,700 | $195,300 |
| 2019 | $4,593 | $262,000 | $66,700 | $195,300 |
| 2018 | $4,374 | $248,500 | $60,700 | $187,800 |
| 2017 | $4,262 | $248,500 | $60,700 | $187,800 |
| 2016 | $4,051 | $248,500 | $60,700 | $187,800 |
| 2014 | $3,951 | $248,500 | $60,700 | $187,800 |
| 2013 | $3,988 | $248,500 | $60,700 | $187,800 |
Source: Public Records
Map
Nearby Homes
Your Personal Tour Guide
Ask me questions while you tour the home.