6 Cole Rd Marion, MA 02738
Estimated Value: $403,000 - $967,000
1
Bed
1
Bath
816
Sq Ft
$776/Sq Ft
Est. Value
About This Home
This home is located at 6 Cole Rd, Marion, MA 02738 and is currently estimated at $633,333, approximately $776 per square foot. 6 Cole Rd is a home located in Plymouth County with nearby schools including Old Rochester Regional High School and Tabor Academy.
Ownership History
Date
Name
Owned For
Owner Type
Purchase Details
Closed on
Oct 4, 2021
Sold by
Whittaker Shane C and Whittaker Denise
Bought by
Whittaker Shane C and Whittaker Denise
Current Estimated Value
Purchase Details
Closed on
Sep 12, 2018
Sold by
Whittaker Gayle
Bought by
Whittaker Shane C
Purchase Details
Closed on
Jun 30, 2015
Sold by
Whittaker Shane C
Bought by
Whittaker Shane C and Whittaker Denise
Purchase Details
Closed on
Aug 22, 1977
Bought by
Whittaker Shane C and Whittaker Denise
Create a Home Valuation Report for This Property
The Home Valuation Report is an in-depth analysis detailing your home's value as well as a comparison with similar homes in the area
Purchase History
We collect this data history from publicly available records. To have your information removed, we recommend requesting removal directly through your county’s website.
| Date | Buyer | Sale Price | Title Company |
|---|---|---|---|
| Whittaker Shane C | -- | None Available | |
| Whittaker Shane C | -- | -- | |
| Whittaker Shane C | -- | -- | |
| Whittaker Shane C | -- | -- |
Source: Public Records
Tax History
| Year | Tax Paid | Tax Assessment Tax Assessment Total Assessment is a certain percentage of the fair market value that is determined by local assessors to be the total taxable value of land and additions on the property. | Land | Improvement |
|---|---|---|---|---|
| 2025 | $3,060 | $328,300 | $153,000 | $175,300 |
| 2024 | $2,970 | $320,700 | $142,800 | $177,900 |
| 2023 | $3,185 | $337,400 | $183,600 | $153,800 |
| 2022 | $2,824 | $260,300 | $125,500 | $134,800 |
| 2021 | $2,536 | $224,000 | $99,900 | $124,100 |
| 2020 | $2,559 | $218,700 | $99,900 | $118,800 |
| 2019 | $2,338 | $212,000 | $99,900 | $112,100 |
| 2018 | $2,405 | $210,000 | $108,100 | $101,900 |
| 2017 | $2,320 | $203,300 | $108,100 | $95,200 |
| 2016 | $2,101 | $185,800 | $87,900 | $97,900 |
| 2015 | -- | $164,700 | $80,300 | $84,400 |
Source: Public Records
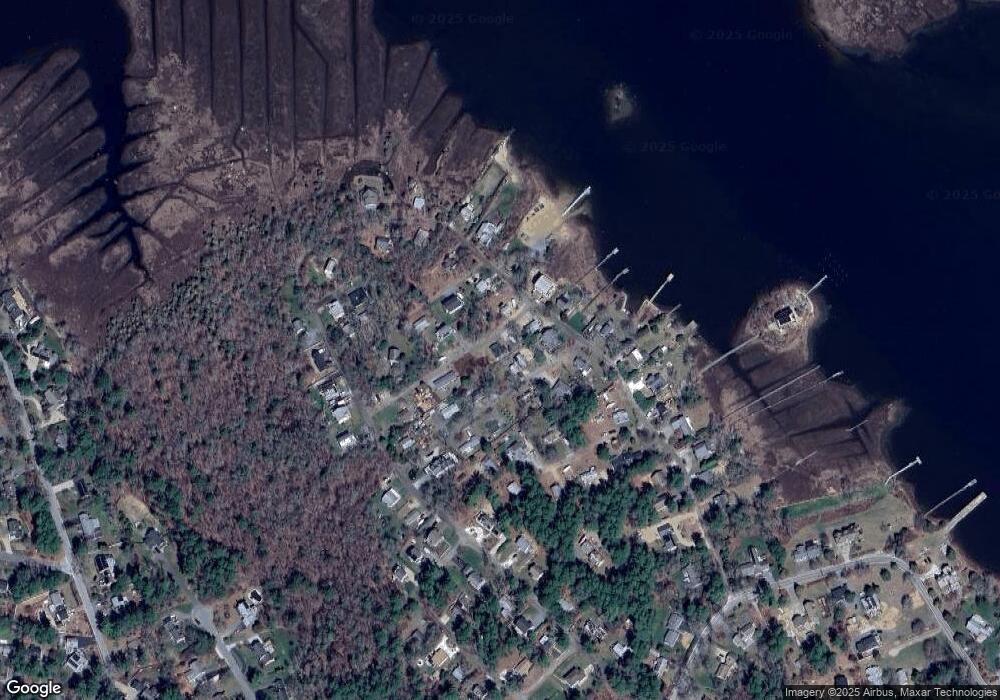
Map
Nearby Homes
- 44 Stoney Run Ln
- 492 Delano Rd
- 16 Bass Point Rd
- 0 Cross Neck Rd Unit 73420524
- 0 Cross Neck Rd Unit 73466177
- 0 Cross Neck Rd Unit 73420525
- 9 Deer Run
- 26 Washington Dr
- 37 Lincoln Hwy
- 12 Taft St
- 22 Fairfield Dr
- 170 Wareham Rd
- 174 Cross Neck Rd
- 21 River Rd
- 1 Barnes St
- 36 Wankinquoah Ave
- 64 Rosepoint Ave
- 192 Swifts Beach Rd
- 245 Wareham Rd
- 7 Blackhall Ct
Your Personal Tour Guide
Ask me questions while you tour the home.