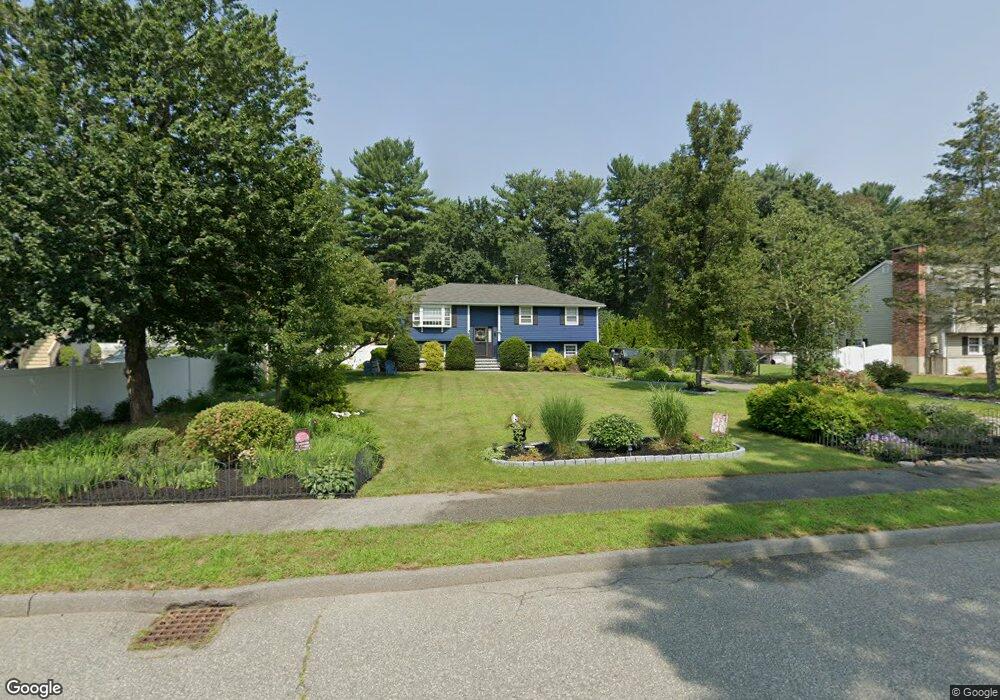
6 Cushing Dr Wilmington, MA 01887
Estimated Value: $779,058 - $802,000
3
Beds
2
Baths
1,119
Sq Ft
$705/Sq Ft
Est. Value
About This Home
This home is located at 6 Cushing Dr, Wilmington, MA 01887 and is currently estimated at $788,515, approximately $704 per square foot. 6 Cushing Dr is a home located in Middlesex County with nearby schools including Wilmington Middle School, Wilmington High School, and Abundant Life Christian School and Childcare.
Ownership History
Date
Name
Owned For
Owner Type
Purchase Details
Closed on
Mar 21, 2019
Sold by
Antico Joanne M
Bought by
Mede Richard and Mede Joanne M
Current Estimated Value
Purchase Details
Closed on
Aug 9, 1991
Sold by
Northeastern Dev Corp
Bought by
Antico Jo Anne and George Antico
Create a Home Valuation Report for This Property
The Home Valuation Report is an in-depth analysis detailing your home's value as well as a comparison with similar homes in the area
Purchase History
| Date | Buyer | Sale Price | Title Company |
|---|---|---|---|
| Mede Richard | -- | None Available | |
| Antico Jo Anne | $186,900 | -- |
Source: Public Records
Mortgage History
| Date | Status | Borrower | Loan Amount |
|---|---|---|---|
| Previous Owner | Antico Jo Anne | $168,000 | |
| Previous Owner | Antico Jo Anne | $166,000 | |
| Previous Owner | Antico Jo Anne | $146,000 |
Source: Public Records
Tax History
| Year | Tax Paid | Tax Assessment Tax Assessment Total Assessment is a certain percentage of the fair market value that is determined by local assessors to be the total taxable value of land and additions on the property. | Land | Improvement |
|---|---|---|---|---|
| 2025 | $7,896 | $689,600 | $315,900 | $373,700 |
| 2024 | $7,827 | $684,800 | $315,900 | $368,900 |
| 2023 | $7,585 | $635,300 | $287,200 | $348,100 |
| 2022 | $7,165 | $549,900 | $239,300 | $310,600 |
| 2021 | $7,105 | $513,400 | $217,500 | $295,900 |
| 2020 | $7,199 | $530,100 | $217,500 | $312,600 |
| 2019 | $6,666 | $484,800 | $207,100 | $277,700 |
| 2018 | $6,187 | $436,400 | $197,300 | $239,100 |
| 2017 | $6,187 | $428,200 | $197,300 | $230,900 |
| 2016 | $5,919 | $404,600 | $188,000 | $216,600 |
| 2015 | $5,646 | $392,900 | $188,000 | $204,900 |
| 2014 | $5,324 | $373,900 | $179,100 | $194,800 |
Source: Public Records
Map
Nearby Homes
Your Personal Tour Guide
Ask me questions while you tour the home.