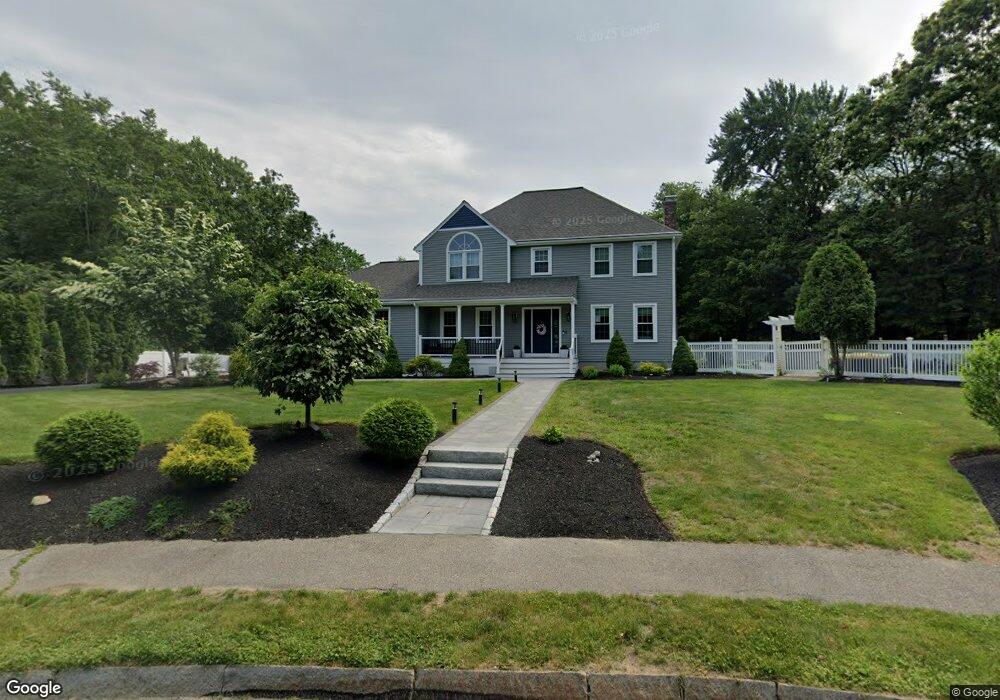
6 Deer Path Cir Mansfield, MA 02048
Estimated Value: $915,181 - $970,000
4
Beds
3
Baths
2,254
Sq Ft
$420/Sq Ft
Est. Value
About This Home
This home is located at 6 Deer Path Cir, Mansfield, MA 02048 and is currently estimated at $946,545, approximately $419 per square foot. 6 Deer Path Cir is a home located in Bristol County with nearby schools including Jordan/Jackson Elementary School, Everett W. Robinson Elementary School, and Harold L. Qualters Middle School.
Ownership History
Date
Name
Owned For
Owner Type
Purchase Details
Closed on
Jun 21, 2007
Sold by
Resh Guy C and Resh Karen L
Bought by
Phillips Christopher L and Phillips Kasey L
Current Estimated Value
Home Financials for this Owner
Home Financials are based on the most recent Mortgage that was taken out on this home.
Original Mortgage
$417,000
Interest Rate
6.14%
Mortgage Type
Purchase Money Mortgage
Purchase Details
Closed on
May 15, 1997
Sold by
Obrien & Meeks Constr
Bought by
Resh Guy C and Resch Karen L
Purchase Details
Closed on
Dec 14, 1995
Sold by
Obrien & Meeks Constr
Bought by
Robinson Court Rt
Create a Home Valuation Report for This Property
The Home Valuation Report is an in-depth analysis detailing your home's value as well as a comparison with similar homes in the area
Home Values in the Area
Average Home Value in this Area
Purchase History
We collect this data history from publicly available records. To have your information removed, we recommend requesting removal directly through your county’s website.
| Date | Buyer | Sale Price | Title Company |
|---|---|---|---|
| Phillips Christopher L | $535,500 | -- | |
| Resh Guy C | $273,000 | -- | |
| Obrien & Meeks Constr | $85,000 | -- | |
| Robinson Court Rt | $90,000 | -- |
Source: Public Records
Mortgage History
We collect this data history from publicly available records. To have your information removed, we recommend requesting removal directly through your county’s website.
| Date | Status | Borrower | Loan Amount |
|---|---|---|---|
| Open | Robinson Court Rt | $408,000 | |
| Closed | Phillips Christopher L | $417,000 | |
| Previous Owner | Robinson Court Rt | $240,000 | |
| Previous Owner | Robinson Court Rt | $35,000 |
Source: Public Records
Tax History
| Year | Tax Paid | Tax Assessment Tax Assessment Total Assessment is a certain percentage of the fair market value that is determined by local assessors to be the total taxable value of land and additions on the property. | Land | Improvement |
|---|---|---|---|---|
| 2025 | $10,550 | $801,100 | $278,100 | $523,000 |
| 2024 | $10,040 | $743,700 | $290,200 | $453,500 |
| 2023 | $9,708 | $689,000 | $290,200 | $398,800 |
| 2022 | $9,319 | $614,300 | $268,600 | $345,700 |
| 2021 | $8,880 | $578,100 | $223,900 | $354,200 |
| 2020 | $8,740 | $569,000 | $223,900 | $345,100 |
| 2019 | $8,251 | $542,100 | $186,500 | $355,600 |
| 2018 | $8,209 | $527,200 | $177,900 | $349,300 |
| 2017 | $7,702 | $512,800 | $172,800 | $340,000 |
| 2016 | $7,250 | $470,500 | $164,500 | $306,000 |
| 2015 | $7,053 | $455,000 | $164,500 | $290,500 |
Source: Public Records
Map
Nearby Homes
- 2 Deer Path Cir
- 12 Deer Path Cir
- 51 Deer Path Ln
- 5 Deer Path Cir
- 9 Deer Path Cir
- 55 Deer Path Ln
- 48 Deer Path Ln
- 35 Deer Path Ln
- 59 Deer Path Ln
- 52 Deer Path Ln
- 36 Deer Path Ln
- 31 Deer Path Ln
- 58 Deer Path Ln
- 32 Deer Path Ln
- 63 Deer Path Ln
- 28 Deer Path Ln
- 62 Deer Path Ln
- 39 Fieldstone Dr
- 27 Deer Path Ln
- 67 Deer Path Ln
Your Personal Tour Guide
Ask me questions while you tour the home.