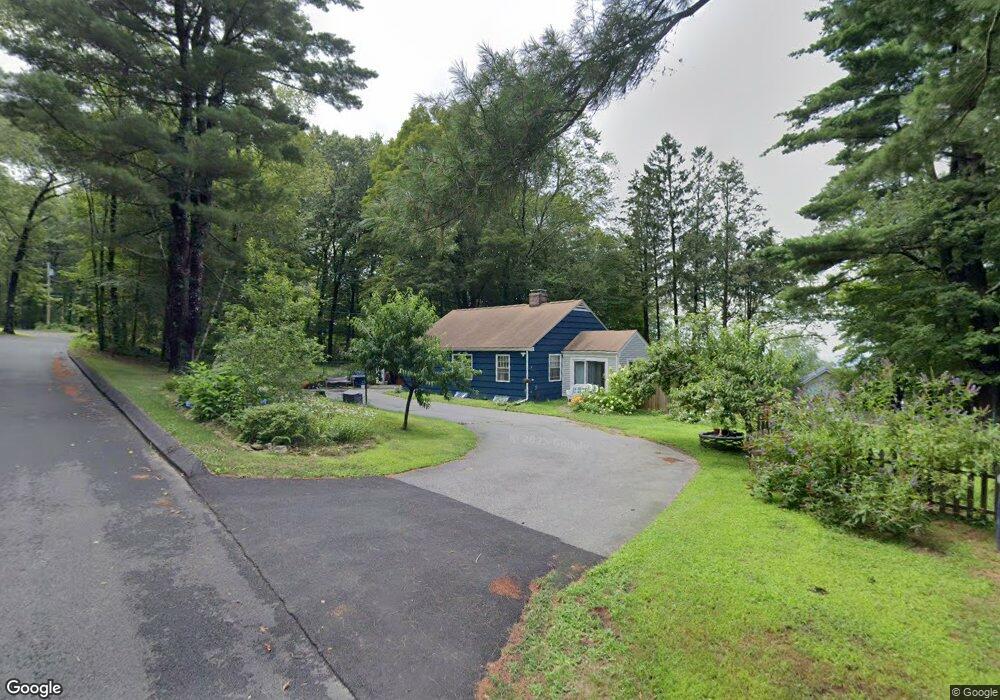
6 Ely Rd Wilbraham, MA 01095
Estimated Value: $277,448 - $511,000
3
Beds
1
Bath
1,368
Sq Ft
$275/Sq Ft
Est. Value
About This Home
This home is located at 6 Ely Rd, Wilbraham, MA 01095 and is currently estimated at $376,612, approximately $275 per square foot. 6 Ely Rd is a home located in Hampden County with nearby schools including Minnechaug Regional High School and Wilbraham & Monson Academy.
Ownership History
Date
Name
Owned For
Owner Type
Purchase Details
Closed on
Apr 3, 2025
Sold by
Chapline Michael L and Chapline Lisa M
Bought by
Chapline Lisa M
Current Estimated Value
Purchase Details
Closed on
Apr 29, 2011
Sold by
Gilbert Theodore
Bought by
Chapline Michael L and Chapline Lisa M
Home Financials for this Owner
Home Financials are based on the most recent Mortgage that was taken out on this home.
Original Mortgage
$171,101
Interest Rate
4.76%
Mortgage Type
Purchase Money Mortgage
Create a Home Valuation Report for This Property
The Home Valuation Report is an in-depth analysis detailing your home's value as well as a comparison with similar homes in the area
Home Values in the Area
Average Home Value in this Area
Purchase History
| Date | Buyer | Sale Price | Title Company |
|---|---|---|---|
| Chapline Lisa M | -- | None Available | |
| Chapline Lisa M | -- | None Available | |
| Chapline Michael L | $167,500 | -- | |
| Chapline Michael L | $167,500 | -- |
Source: Public Records
Mortgage History
| Date | Status | Borrower | Loan Amount |
|---|---|---|---|
| Previous Owner | Chapline Michael L | $171,101 |
Source: Public Records
Tax History
| Year | Tax Paid | Tax Assessment Tax Assessment Total Assessment is a certain percentage of the fair market value that is determined by local assessors to be the total taxable value of land and additions on the property. | Land | Improvement |
|---|---|---|---|---|
| 2025 | $1,990 | $111,300 | $108,600 | $2,700 |
| 2024 | $4,899 | $264,800 | $108,600 | $156,200 |
| 2023 | $4,661 | $235,700 | $107,400 | $128,300 |
| 2022 | $4,661 | $227,500 | $107,400 | $120,100 |
| 2021 | $4,796 | $208,900 | $113,600 | $95,300 |
| 2020 | $4,675 | $208,900 | $113,600 | $95,300 |
| 2019 | $4,554 | $208,900 | $113,600 | $95,300 |
| 2018 | $4,485 | $198,100 | $113,600 | $84,500 |
| 2017 | $4,358 | $198,100 | $113,600 | $84,500 |
| 2016 | $4,368 | $202,200 | $125,600 | $76,600 |
| 2015 | $4,222 | $202,200 | $125,600 | $76,600 |
Source: Public Records
Map
Nearby Homes
- 474-480 Mountain Rd
- 474 Mountain Rd
- 745 Glendale Rd
- 7 Highridge Rd
- 6 Hilltop Park
- 3 Red Gap Rd
- 5v Red Gap Rd
- 16 Falcon Heights
- 172 Main St
- 1 Aspen Dr
- 8 High Pine Cir
- 8 Patriot Ridge Ln
- 104 High Pine Cir
- 733 Monson Rd
- 36 Maple St
- 35 Lake Dr
- 1070 Glendale Rd
- 5 Silver St
- 14 Willow Brook Ln
- 46 Washington Rd
Your Personal Tour Guide
Ask me questions while you tour the home.