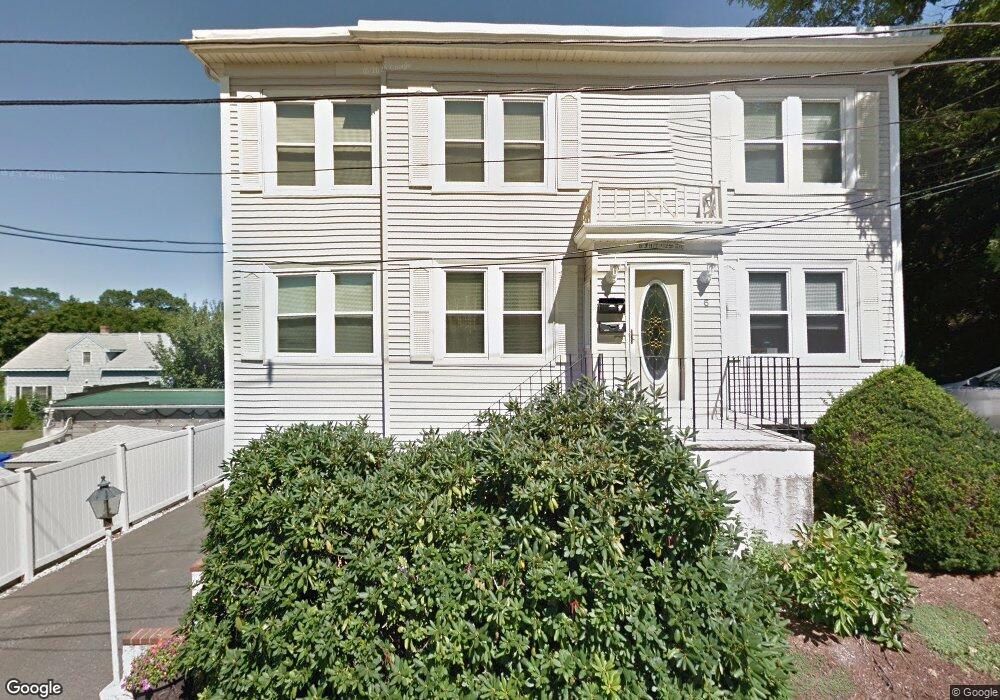
6 Fairview Rd Peabody, MA 01960
South Peabody NeighborhoodEstimated Value: $697,000 - $893,000
4
Beds
2
Baths
2,238
Sq Ft
$355/Sq Ft
Est. Value
About This Home
This home is located at 6 Fairview Rd, Peabody, MA 01960 and is currently estimated at $793,729, approximately $354 per square foot. 6 Fairview Rd is a home located in Essex County with nearby schools including Peabody Veterans Memorial High School, North Shore Christian School, and St. Pius V. School.
Ownership History
Date
Name
Owned For
Owner Type
Purchase Details
Closed on
May 30, 2024
Sold by
Lonigro Robert A
Bought by
Six Road Fairview Llc
Current Estimated Value
Purchase Details
Closed on
Jan 23, 2001
Sold by
Goodwin Paul D and Goodwin Sarah E
Bought by
Lonigro Robert A
Create a Home Valuation Report for This Property
The Home Valuation Report is an in-depth analysis detailing your home's value as well as a comparison with similar homes in the area
Home Values in the Area
Average Home Value in this Area
Purchase History
We collect this data history from publicly available records. To have your information removed, we recommend requesting removal directly through your county’s website.
| Date | Buyer | Sale Price | Title Company |
|---|---|---|---|
| Six Road Fairview Llc | -- | None Available | |
| Six Road Fairview Llc | -- | None Available | |
| Lonigro Robert A | $280,000 | -- | |
| Lonigro Robert A | $280,000 | -- |
Source: Public Records
Mortgage History
We collect this data history from publicly available records. To have your information removed, we recommend requesting removal directly through your county’s website.
| Date | Status | Borrower | Loan Amount |
|---|---|---|---|
| Previous Owner | Lonigro Robert A | $54,000 | |
| Previous Owner | Lonigro Robert A | $220,406 | |
| Previous Owner | Lonigro Robert A | $224,000 |
Source: Public Records
Tax History
| Year | Tax Paid | Tax Assessment Tax Assessment Total Assessment is a certain percentage of the fair market value that is determined by local assessors to be the total taxable value of land and additions on the property. | Land | Improvement |
|---|---|---|---|---|
| 2025 | $6,888 | $743,800 | $220,000 | $523,800 |
| 2024 | $6,028 | $661,000 | $220,000 | $441,000 |
| 2023 | $5,424 | $569,700 | $196,500 | $373,200 |
| 2022 | $5,375 | $532,200 | $175,500 | $356,700 |
| 2021 | $5,368 | $511,700 | $159,500 | $352,200 |
| 2020 | $5,273 | $491,000 | $159,500 | $331,500 |
| 2019 | $5,169 | $469,500 | $159,500 | $310,000 |
| 2018 | $4,300 | $375,200 | $145,000 | $230,200 |
| 2017 | $4,462 | $379,400 | $145,000 | $234,400 |
| 2016 | $4,197 | $352,100 | $145,000 | $207,100 |
| 2015 | $3,636 | $295,600 | $141,400 | $154,200 |
Source: Public Records
Map
Nearby Homes
- 300 Lynn St
- 23 Batchelder Ave
- 40 Glenwood Rd
- 52 Glenwood Rd
- 131 Range Heights Rd
- 73 Lockwood Rd
- 9 Longview Way
- 19 Bartholomew Terrace
- 0 & 8 Bagley Terrace
- 46 Clairmont St
- 273 & 273R Euclid Ave
- 11 Otis St
- 46 Grand View Ave
- 77 Verona St
- 12 Cannon Rock Rd
- 29 Bacheller St
- 2 Columbia Blvd
- 257 Lynnfield St
- 24 Sylvia St
- 25 Gordon Rd
Your Personal Tour Guide
Ask me questions while you tour the home.