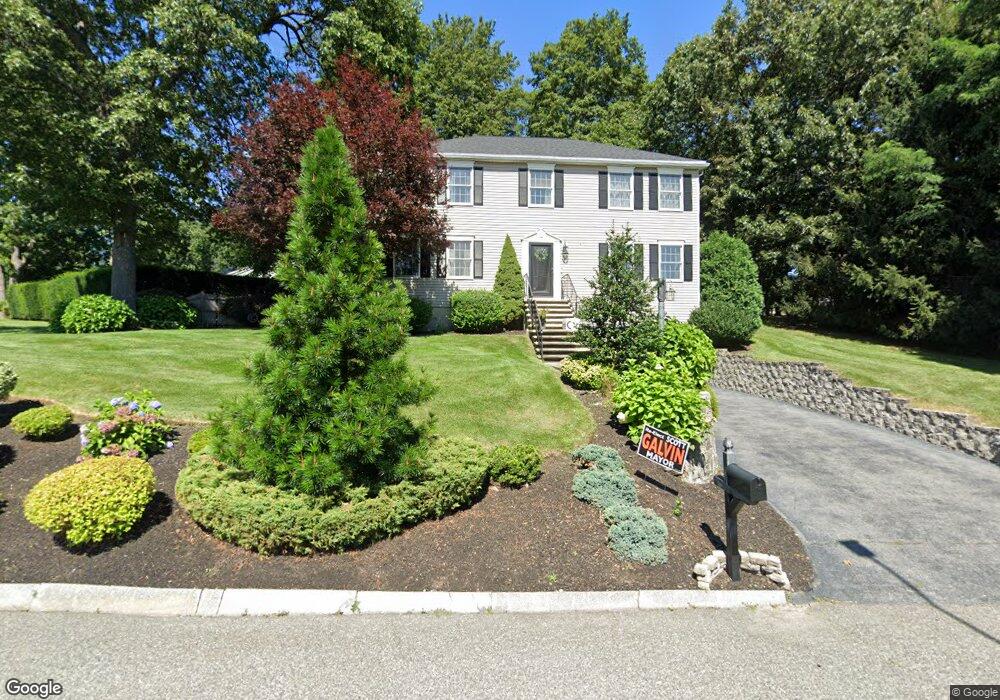
6 Hawley St Woburn, MA 01801
Downtown Woburn NeighborhoodEstimated Value: $798,000 - $996,000
About This Home
This home is located at 6 Hawley St, Woburn, MA 01801 and is currently estimated at $927,093, approximately $441 per square foot. 6 Hawley St is a home located in Middlesex County with nearby schools including Shamrock Elementary School, Daniel L. Joyce Middle School, and Woburn High School.
Ownership History
We collect this data history from publicly available records. To have your information removed, we recommend requesting removal directly through your county’s website.
Purchase Details
Purchase Details
Home Financials for this Owner
Home Financials are based on the most recent Mortgage that was taken out on this home.Home Values in the Area
Average Home Value in this Area
Purchase History
We collect this data history from publicly available records. To have your information removed, we recommend requesting removal directly through your county’s website.
| Date | Buyer | Sale Price | Title Company |
|---|---|---|---|
| -- | None Available | ||
| -- | None Available | ||
| $125,000 | -- |
Mortgage History
We collect this data history from publicly available records. To have your information removed, we recommend requesting removal directly through your county’s website.
| Date | Status | Borrower | Loan Amount |
|---|---|---|---|
| Previous Owner | $150,000 | ||
| Previous Owner | $200,000 |
Tax History
We collect this data history from publicly available records. To have your information removed, we recommend requesting removal directly through your county’s website.
| Year | Tax Paid | Tax Assessment Tax Assessment Total Assessment is a certain percentage of the fair market value that is determined by local assessors to be the total taxable value of land and additions on the property. | Land | Improvement |
|---|---|---|---|---|
| 2025 | $7,852 | $919,400 | $335,200 | $584,200 |
| 2024 | $7,058 | $875,700 | $319,200 | $556,500 |
| 2023 | $6,881 | $790,900 | $290,300 | $500,600 |
| 2022 | $6,751 | $722,800 | $252,500 | $470,300 |
| 2021 | $0 | $695,700 | $240,500 | $455,200 |
| 2020 | $6,226 | $668,000 | $240,500 | $427,500 |
| 2019 | $6,007 | $632,300 | $229,100 | $403,200 |
| 2018 | $0 | $582,400 | $210,200 | $372,200 |
| 2017 | $79,218 | $536,700 | $200,300 | $336,400 |
| 2016 | $5,107 | $508,200 | $187,200 | $321,000 |
| 2015 | $5,008 | $492,400 | $175,000 | $317,400 |
| 2014 | $4,840 | $463,600 | $175,000 | $288,600 |
Map
- 4 Laurel St
- 9 James Terrace
- 8 Woods Hill Cir
- 164 Green St
- 219 Montvale Ae
- 18 Sherman Place
- 69r Eastern Ave
- 6 Packard St
- 42 Wood St
- 0 Mount Pleasant St
- 92 Garfield Ave
- 35 Montvale Ave Unit 3
- 12 Highland Ave
- 28 Everett St
- 7 Prospect St
- 74 Beach St Unit 6-8
- 201 Main St Unit 31
- 477 Main St
- 16 Felton St
- 55 Brookside Ave
Ask me questions while you tour the home.