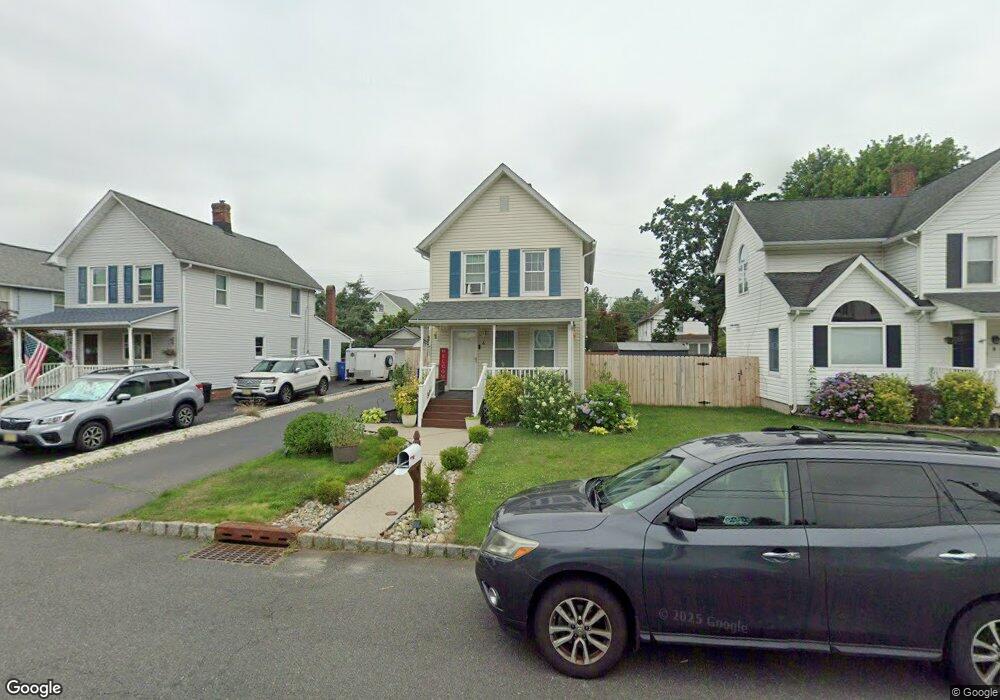
6 John St Unit none Helmetta, NJ 08828
Estimated Value: $351,815 - $416,000
2
Beds
1
Bath
1,104
Sq Ft
$353/Sq Ft
Est. Value
About This Home
This home is located at 6 John St Unit none, Helmetta, NJ 08828 and is currently estimated at $389,954, approximately $353 per square foot. 6 John St Unit none is a home located in Middlesex County with nearby schools including G. Austin Schoenly Elementary School, E. Raymond Appleby Elementary School, and Spotswood Memorial School.
Ownership History
Date
Name
Owned For
Owner Type
Purchase Details
Closed on
May 21, 2021
Sold by
Herner Karen A
Bought by
Bryant Maurice P and Guillaume Esther
Current Estimated Value
Home Financials for this Owner
Home Financials are based on the most recent Mortgage that was taken out on this home.
Original Mortgage
$279,837
Outstanding Balance
$252,805
Interest Rate
2.9%
Mortgage Type
FHA
Estimated Equity
$137,149
Purchase Details
Closed on
Apr 21, 2021
Sold by
Herner Karen A and Gunderson Karen A
Bought by
Bryant Maurice P and Guillaume Esther
Home Financials for this Owner
Home Financials are based on the most recent Mortgage that was taken out on this home.
Original Mortgage
$279,837
Outstanding Balance
$252,805
Interest Rate
2.9%
Mortgage Type
FHA
Estimated Equity
$137,149
Purchase Details
Closed on
Jan 8, 2002
Create a Home Valuation Report for This Property
The Home Valuation Report is an in-depth analysis detailing your home's value as well as a comparison with similar homes in the area
Home Values in the Area
Average Home Value in this Area
Purchase History
| Date | Buyer | Sale Price | Title Company |
|---|---|---|---|
| Bryant Maurice P | $285,000 | New Title Company Name | |
| Bryant Maurice P | $285,000 | Realsafe Title Llc | |
| -- | -- | -- |
Source: Public Records
Mortgage History
| Date | Status | Borrower | Loan Amount |
|---|---|---|---|
| Open | Bryant Maurice P | $279,837 | |
| Previous Owner | Bryant Maurice P | $279,837 |
Source: Public Records
Tax History
| Year | Tax Paid | Tax Assessment Tax Assessment Total Assessment is a certain percentage of the fair market value that is determined by local assessors to be the total taxable value of land and additions on the property. | Land | Improvement |
|---|---|---|---|---|
| 2025 | $5,649 | $166,700 | $92,100 | $74,600 |
| 2024 | $5,438 | $166,700 | $92,100 | $74,600 |
| 2023 | $5,438 | $166,700 | $92,100 | $74,600 |
| 2022 | $5,389 | $166,700 | $92,100 | $74,600 |
| 2021 | $3,903 | $166,700 | $92,100 | $74,600 |
| 2020 | $5,104 | $166,700 | $92,100 | $74,600 |
| 2019 | $5,149 | $166,700 | $92,100 | $74,600 |
| 2018 | $5,083 | $166,700 | $92,100 | $74,600 |
| 2017 | $4,989 | $166,700 | $92,100 | $74,600 |
| 2016 | $4,791 | $166,700 | $92,100 | $74,600 |
| 2015 | $4,576 | $166,700 | $92,100 | $74,600 |
| 2014 | $4,523 | $166,700 | $92,100 | $74,600 |
Source: Public Records
Map
Nearby Homes
- 24 John St
- 92 Main St
- 10 Ericson Ave
- 6 Holly Manor Ct
- 9 Redwood Ct
- 148 Helmetta Rd
- 15 Sutton Place
- 7 Lake Ave
- 47 Thomas St
- 312 Raintree Ct
- 20 Borghaus Rd
- 18 Avenue B
- 176 Old Forge Rd
- 2710 Ridgefield Ct Unit 2710
- 1007 Meadow Ct
- 40 Avenue I
- 1305 Stoneridge Cir
- 1306 Stoneridge Cir
- 38 Avenue I
- 2308 Candlelight Ct Unit 2308
Your Personal Tour Guide
Ask me questions while you tour the home.