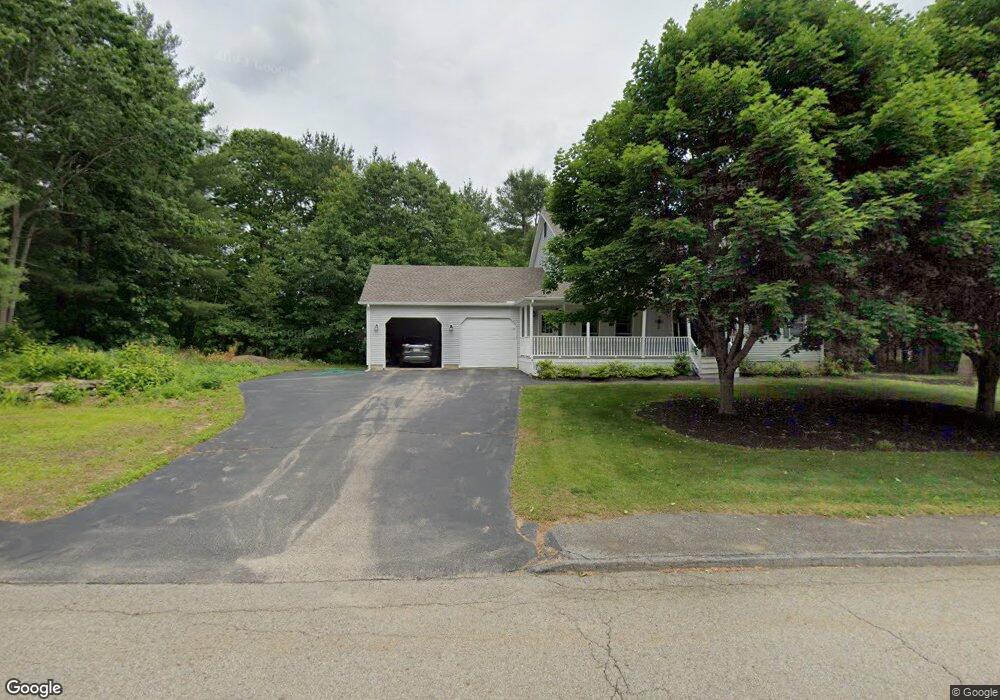
6 Laflash Ln Leicester, MA 01524
Estimated Value: $527,724 - $665,000
3
Beds
2
Baths
2,200
Sq Ft
$262/Sq Ft
Est. Value
About This Home
This home is located at 6 Laflash Ln, Leicester, MA 01524 and is currently estimated at $576,431, approximately $262 per square foot. 6 Laflash Ln is a home located in Worcester County with nearby schools including Leicester Integrated Preschool, Leicester Memorial Elementary School, and Leicester Middle School.
Ownership History
Date
Name
Owned For
Owner Type
Purchase Details
Closed on
Jan 31, 1997
Sold by
Laflash Frederick H
Bought by
Fortin Paul J and Fortin Judy L
Current Estimated Value
Home Financials for this Owner
Home Financials are based on the most recent Mortgage that was taken out on this home.
Original Mortgage
$60,000
Interest Rate
7.65%
Mortgage Type
Purchase Money Mortgage
Create a Home Valuation Report for This Property
The Home Valuation Report is an in-depth analysis detailing your home's value as well as a comparison with similar homes in the area
Home Values in the Area
Average Home Value in this Area
Purchase History
| Date | Buyer | Sale Price | Title Company |
|---|---|---|---|
| Fortin Paul J | $155,677 | -- |
Source: Public Records
Mortgage History
| Date | Status | Borrower | Loan Amount |
|---|---|---|---|
| Closed | Fortin Paul J | $130,000 | |
| Closed | Fortin Paul J | $25,000 | |
| Closed | Fortin Paul J | $91,000 | |
| Closed | Fortin Paul J | $60,000 | |
| Closed | Fortin Paul J | $30,000 |
Source: Public Records
Tax History
| Year | Tax Paid | Tax Assessment Tax Assessment Total Assessment is a certain percentage of the fair market value that is determined by local assessors to be the total taxable value of land and additions on the property. | Land | Improvement |
|---|---|---|---|---|
| 2025 | $57 | $486,400 | $86,800 | $399,600 |
| 2024 | $5,432 | $432,800 | $74,800 | $358,000 |
| 2023 | $5,167 | $401,800 | $74,800 | $327,000 |
| 2022 | $4,971 | $355,300 | $71,000 | $284,300 |
| 2021 | $5,426 | $358,600 | $78,500 | $280,100 |
| 2020 | $5,029 | $337,300 | $74,400 | $262,900 |
| 2019 | $4,913 | $325,800 | $67,400 | $258,400 |
| 2018 | $4,701 | $292,200 | $67,400 | $224,800 |
| 2017 | $4,468 | $288,600 | $67,400 | $221,200 |
| 2016 | $4,239 | $284,500 | $71,000 | $213,500 |
| 2015 | $4,137 | $284,500 | $71,000 | $213,500 |
Source: Public Records
Map
Nearby Homes
- 11 Walbridge Rd
- 17 Walbridge Rd
- 309 Pleasant St
- 150 Paxton St
- 4 Crestwood Rd
- 1576 Main St
- 0 S Main St Unit 73392435
- 9 Forestdale Rd
- 1A S Main St
- 620 Pleasant St
- 963 Main St
- 78 Asnebumskit Rd
- 7 Cedar Rd
- 155 Rawson St
- 99 Lakeshore Dr
- 16 Windemere Rd
- 46 Chapel St
- 37 Thompson Pond Rd
- 148A Tory Fort Ln
- 618 Mill St
Your Personal Tour Guide
Ask me questions while you tour the home.