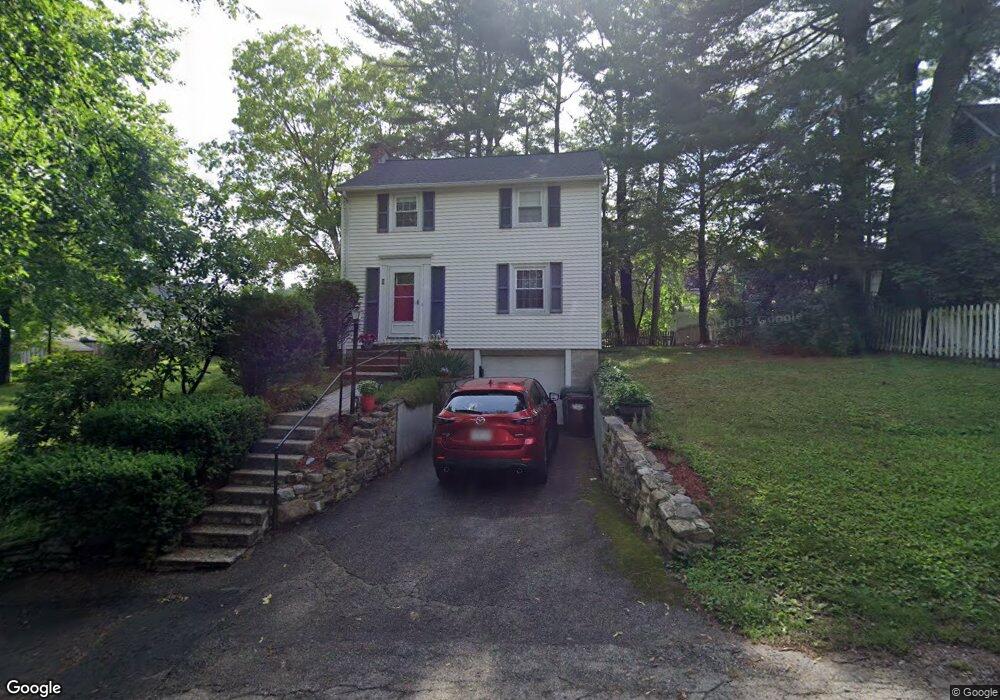
6 Lancaster St Auburn, MA 01501
Downtown Auburn NeighborhoodEstimated Value: $427,000 - $499,000
About This Home
This home is located at 6 Lancaster St, Auburn, MA 01501 and is currently estimated at $454,298, approximately $290 per square foot. 6 Lancaster St is a home located in Worcester County with nearby schools including Auburn Senior High School and Shrewsbury Montessori School - Auburn Campus.
Ownership History
We collect this data history from publicly available records. To have your information removed, we recommend requesting removal directly through your county’s website.
Purchase Details
Home Financials for this Owner
Home Financials are based on the most recent Mortgage that was taken out on this home.Purchase Details
Purchase Details
Home Values in the Area
Average Home Value in this Area
Purchase History
We collect this data history from publicly available records. To have your information removed, we recommend requesting removal directly through your county’s website.
| Date | Buyer | Sale Price | Title Company |
|---|---|---|---|
| $265,000 | -- | ||
| $162,500 | -- | ||
| $150,000 | -- |
Mortgage History
We collect this data history from publicly available records. To have your information removed, we recommend requesting removal directly through your county’s website.
| Date | Status | Borrower | Loan Amount |
|---|---|---|---|
| Open | $242,000 | ||
| Closed | $251,750 | ||
| Previous Owner | $170,400 |
Tax History
We collect this data history from publicly available records. To have your information removed, we recommend requesting removal directly through your county’s website.
| Year | Tax Paid | Tax Assessment Tax Assessment Total Assessment is a certain percentage of the fair market value that is determined by local assessors to be the total taxable value of land and additions on the property. | Land | Improvement |
|---|---|---|---|---|
| 2025 | $56 | $394,800 | $135,200 | $259,600 |
| 2024 | $5,720 | $383,100 | $128,100 | $255,000 |
| 2023 | $5,458 | $343,700 | $116,400 | $227,300 |
| 2022 | $5,112 | $303,900 | $116,400 | $187,500 |
| 2021 | $6,266 | $266,700 | $102,700 | $164,000 |
| 2020 | $4,795 | $266,700 | $102,700 | $164,000 |
| 2019 | $4,693 | $254,800 | $101,700 | $153,100 |
| 2018 | $4,817 | $242,200 | $95,000 | $147,200 |
| 2017 | $4,281 | $233,400 | $86,200 | $147,200 |
| 2016 | $4,092 | $226,200 | $89,900 | $136,300 |
| 2015 | $3,764 | $218,100 | $89,900 | $128,200 |
| 2014 | $3,688 | $213,300 | $85,500 | $127,800 |
Map
- 11 Paul St
- 79 Central St
- 48 Central St
- 29 Winchester Ave
- 36 Central St
- 182 Leicester St
- 137 Bryn Mawr Ave
- 137 South St
- 4 Mayfield Rd
- 611 Oxford St S
- 328 Oxford St N
- 4 Victoria Dr Unit 1
- 55 Old Common Rd
- 3 Santom St
- 10 Park St
- 35 Burnap St
- 112 Elm St
- 330 Leicester St
- 41 Highland St
- 8 Woodside Terrace
Ask me questions while you tour the home.