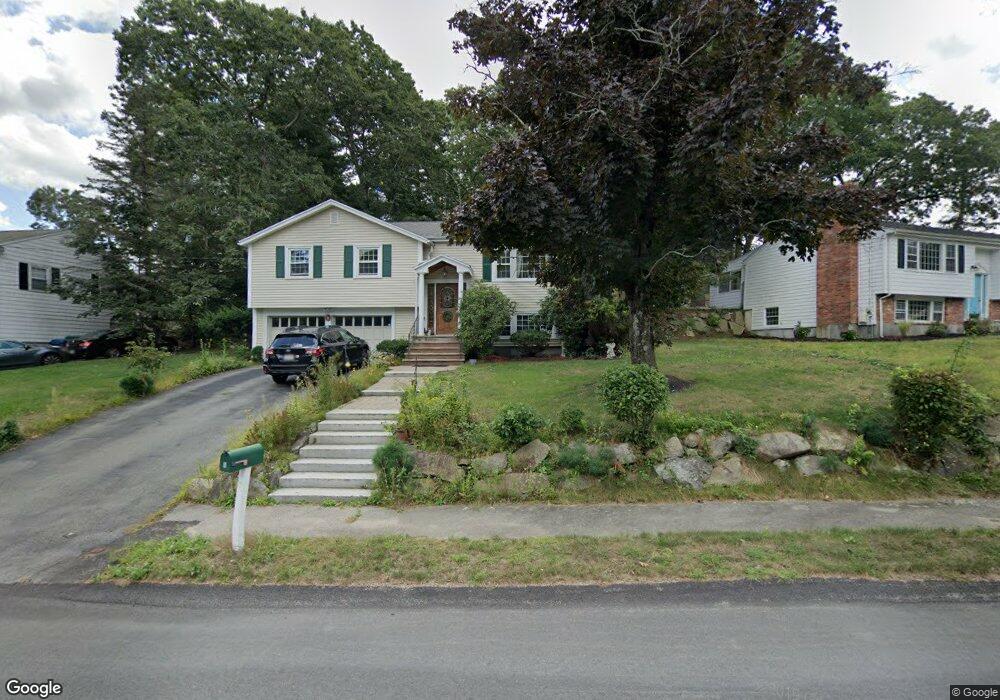
6 Lehan St Canton, MA 02021
Canton AreaEstimated Value: $738,000 - $879,000
About This Home
This home is located at 6 Lehan St, Canton, MA 02021 and is currently estimated at $780,072, approximately $515 per square foot. 6 Lehan St is a home located in Norfolk County with nearby schools including Canton High School, St. John the Evangelist School, and Chabad Day School of School.
Ownership History
We collect this data history from publicly available records. To have your information removed, we recommend requesting removal directly through your county’s website.
Purchase Details
Purchase Details
Purchase Details
Home Values in the Area
Average Home Value in this Area
Purchase History
We collect this data history from publicly available records. To have your information removed, we recommend requesting removal directly through your county’s website.
| Date | Buyer | Sale Price | Title Company |
|---|---|---|---|
| -- | -- | ||
| $187,000 | -- | ||
| $216,000 | -- |
Mortgage History
We collect this data history from publicly available records. To have your information removed, we recommend requesting removal directly through your county’s website.
| Date | Status | Borrower | Loan Amount |
|---|---|---|---|
| Previous Owner | $150,000 | ||
| Previous Owner | $100,000 |
Tax History
We collect this data history from publicly available records. To have your information removed, we recommend requesting removal directly through your county’s website.
| Year | Tax Paid | Tax Assessment Tax Assessment Total Assessment is a certain percentage of the fair market value that is determined by local assessors to be the total taxable value of land and additions on the property. | Land | Improvement |
|---|---|---|---|---|
| 2025 | $6,403 | $647,400 | $294,600 | $352,800 |
| 2024 | $6,208 | $622,700 | $283,300 | $339,400 |
| 2023 | $6,082 | $575,400 | $283,300 | $292,100 |
| 2022 | $5,731 | $504,900 | $269,800 | $235,100 |
| 2021 | $5,614 | $460,200 | $245,300 | $214,900 |
| 2020 | $5,296 | $433,000 | $233,600 | $199,400 |
| 2019 | $5,202 | $419,500 | $212,300 | $207,200 |
| 2018 | $5,013 | $403,600 | $204,200 | $199,400 |
| 2017 | $5,061 | $395,700 | $200,200 | $195,500 |
| 2016 | $4,877 | $381,300 | $195,300 | $186,000 |
| 2015 | $4,725 | $368,600 | $189,600 | $179,000 |
Map
- 5 Sapphire Cir Unit Lot 4
- 15 Sapphire Cir Unit Lot 3
- 207 Mechanic St Unit 207
- 3 Walnut Knolls
- 77 Messinger St
- 42 Messinger St
- 60 Coppersmith Way Unit 402
- 206 Greenbrook Dr
- 52 Rosewood Dr
- 153 Greenbrook Dr Unit 153
- 91 Rosewood Dr Unit 91
- 64 Laurelwood Dr
- 167 Greenbrook Dr
- 41 Jessica Dr Unit E
- 34 Rosewood Dr Unit 34
- 80 Walnut St Unit 402
- 205 Erin Rd
- 127 Greenbrook Dr
- 6 Jennifer Ln
- 11 Elderwood Dr Unit 11
Ask me questions while you tour the home.