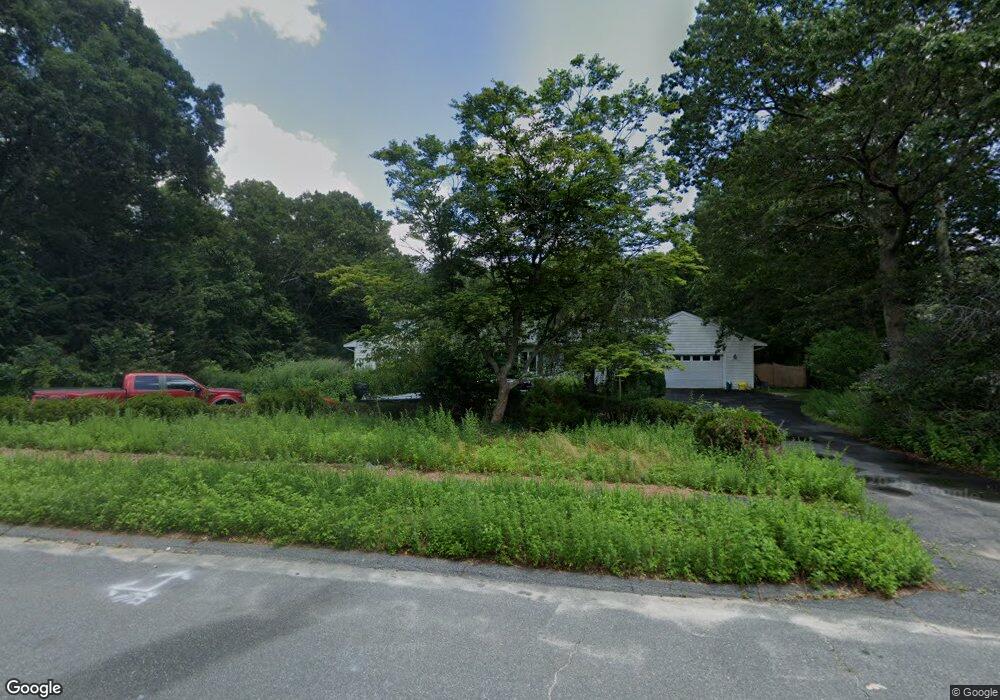
6 Lois Ln Sharon, MA 02067
Estimated Value: $1,164,000 - $1,418,000
6
Beds
3
Baths
4,272
Sq Ft
$303/Sq Ft
Est. Value
About This Home
This home is located at 6 Lois Ln, Sharon, MA 02067 and is currently estimated at $1,295,879, approximately $303 per square foot. 6 Lois Ln is a home located in Norfolk County with nearby schools including East Elementary School, Sharon Middle School, and Sharon High School.
Ownership History
Date
Name
Owned For
Owner Type
Purchase Details
Closed on
Mar 28, 1997
Sold by
Goldstein Paul S and Goldstein Marilyn
Bought by
Goldstein Helayne
Current Estimated Value
Home Financials for this Owner
Home Financials are based on the most recent Mortgage that was taken out on this home.
Original Mortgage
$100,000
Interest Rate
7.59%
Mortgage Type
Purchase Money Mortgage
Purchase Details
Closed on
Sep 7, 1995
Sold by
Giovino Sandra
Bought by
Goldstein Paul S and Goldstein Marilyn
Create a Home Valuation Report for This Property
The Home Valuation Report is an in-depth analysis detailing your home's value as well as a comparison with similar homes in the area
Home Values in the Area
Average Home Value in this Area
Purchase History
We collect this data history from publicly available records. To have your information removed, we recommend requesting removal directly through your county’s website.
| Date | Buyer | Sale Price | Title Company |
|---|---|---|---|
| Goldstein Helayne | $100,000 | -- | |
| Goldstein Paul S | $225,000 | -- |
Source: Public Records
Mortgage History
We collect this data history from publicly available records. To have your information removed, we recommend requesting removal directly through your county’s website.
| Date | Status | Borrower | Loan Amount |
|---|---|---|---|
| Open | Goldstein Paul S | $400,000 | |
| Closed | Goldstein Paul S | $362,000 | |
| Closed | Goldstein Paul S | $100,000 |
Source: Public Records
Tax History
| Year | Tax Paid | Tax Assessment Tax Assessment Total Assessment is a certain percentage of the fair market value that is determined by local assessors to be the total taxable value of land and additions on the property. | Land | Improvement |
|---|---|---|---|---|
| 2025 | $19,151 | $1,095,600 | $510,600 | $585,000 |
| 2024 | $18,784 | $1,068,500 | $468,400 | $600,100 |
| 2023 | $17,768 | $955,800 | $437,600 | $518,200 |
| 2022 | $17,813 | $901,900 | $364,500 | $537,400 |
| 2021 | $17,719 | $867,300 | $344,300 | $523,000 |
| 2020 | $16,775 | $882,900 | $359,900 | $523,000 |
| 2019 | $15,511 | $799,100 | $304,700 | $494,400 |
| 2018 | $15,302 | $790,000 | $298,500 | $491,500 |
| 2017 | $15,121 | $770,700 | $279,200 | $491,500 |
| 2016 | $14,634 | $727,700 | $279,200 | $448,500 |
| 2015 | $14,143 | $696,700 | $254,000 | $442,700 |
| 2014 | $13,134 | $639,100 | $231,300 | $407,800 |
Source: Public Records
Map
Nearby Homes
Your Personal Tour Guide
Ask me questions while you tour the home.