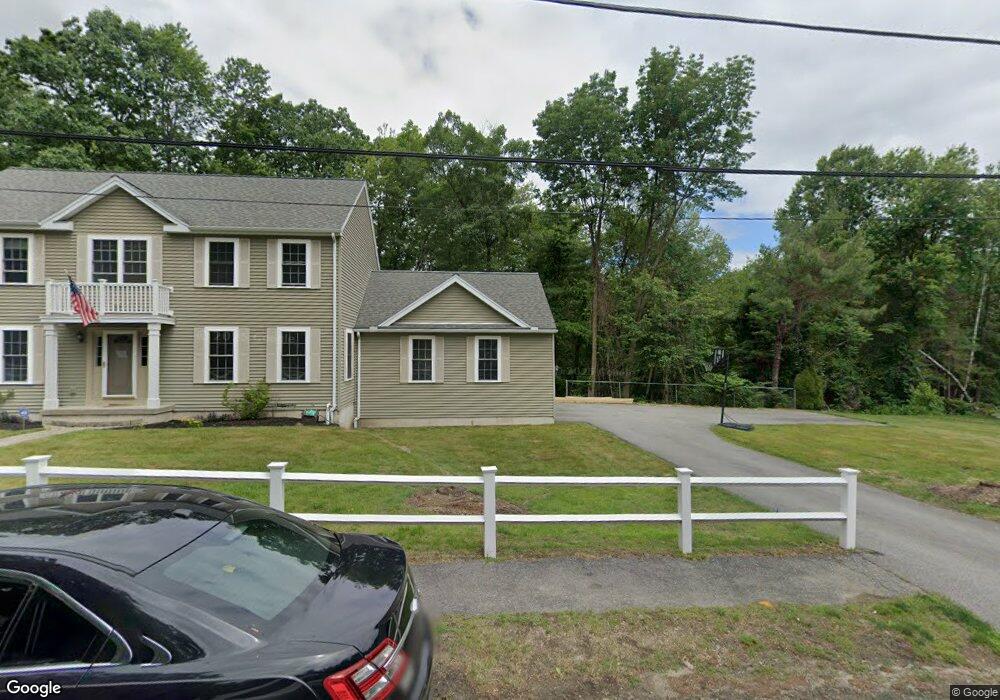
6 Mark Cir Holden, MA 01520
Estimated Value: $732,927 - $779,000
4
Beds
4
Baths
2,412
Sq Ft
$317/Sq Ft
Est. Value
About This Home
This home is located at 6 Mark Cir, Holden, MA 01520 and is currently estimated at $764,232, approximately $316 per square foot. 6 Mark Cir is a home located in Worcester County with nearby schools including Wachusett Regional High School, Bancroft School, and Holden Christian Academy.
Ownership History
Date
Name
Owned For
Owner Type
Purchase Details
Closed on
Nov 17, 2005
Sold by
Mark Circle Rt and Tedesco Richard V
Bought by
Macmaster Donald L and Macmaster Tina A
Current Estimated Value
Home Financials for this Owner
Home Financials are based on the most recent Mortgage that was taken out on this home.
Original Mortgage
$380,000
Outstanding Balance
$208,590
Interest Rate
6.07%
Mortgage Type
Purchase Money Mortgage
Estimated Equity
$555,642
Purchase Details
Closed on
Jul 1, 2005
Sold by
Herring Arthur and Herring Jonathan
Bought by
Mark Circle Rt and Tedesco Richard V
Create a Home Valuation Report for This Property
The Home Valuation Report is an in-depth analysis detailing your home's value as well as a comparison with similar homes in the area
Home Values in the Area
Average Home Value in this Area
Purchase History
| Date | Buyer | Sale Price | Title Company |
|---|---|---|---|
| Macmaster Donald L | $490,000 | -- | |
| Mark Circle Rt | $108,750 | -- |
Source: Public Records
Mortgage History
| Date | Status | Borrower | Loan Amount |
|---|---|---|---|
| Open | Macmaster Donald L | $380,000 |
Source: Public Records
Tax History
| Year | Tax Paid | Tax Assessment Tax Assessment Total Assessment is a certain percentage of the fair market value that is determined by local assessors to be the total taxable value of land and additions on the property. | Land | Improvement |
|---|---|---|---|---|
| 2025 | $9,130 | $658,700 | $183,500 | $475,200 |
| 2024 | $8,807 | $622,400 | $178,000 | $444,400 |
| 2023 | $8,366 | $558,100 | $154,800 | $403,300 |
| 2022 | $7,949 | $480,000 | $121,000 | $359,000 |
| 2021 | $3,433 | $446,200 | $115,200 | $331,000 |
| 2020 | $7,546 | $443,900 | $109,700 | $334,200 |
| 2019 | $7,355 | $421,500 | $109,700 | $311,800 |
| 2018 | $7,121 | $404,400 | $104,500 | $299,900 |
| 2017 | $6,825 | $388,000 | $104,500 | $283,500 |
| 2016 | $6,324 | $366,600 | $99,500 | $267,100 |
| 2015 | $6,454 | $356,200 | $99,500 | $256,700 |
| 2014 | $6,323 | $356,200 | $99,500 | $256,700 |
Source: Public Records
Map
Nearby Homes
- 527 Salisbury St
- 16 Sycamore Dr
- 53 Tea Party Cir
- 339 Salisbury St
- 288 Fisher Rd
- 306 Fisher Rd
- 14 Wyndhurst Dr
- 12 Newell Rd
- 0 Chapin Rd
- 3 Torrey Ln
- 202 Torrey Lane Extension Unit 202
- 3901 Knightsbridge Close Unit 3901
- 4004 Brompton Cir
- 6 Barrows Rd
- 158 Chester St
- 770 Salisbury St Unit 424
- 23 Leslie Rd
- 90 Bjorklund Ave
- 42 N Worcester Ave
- 7 Wildwood Rd
Your Personal Tour Guide
Ask me questions while you tour the home.