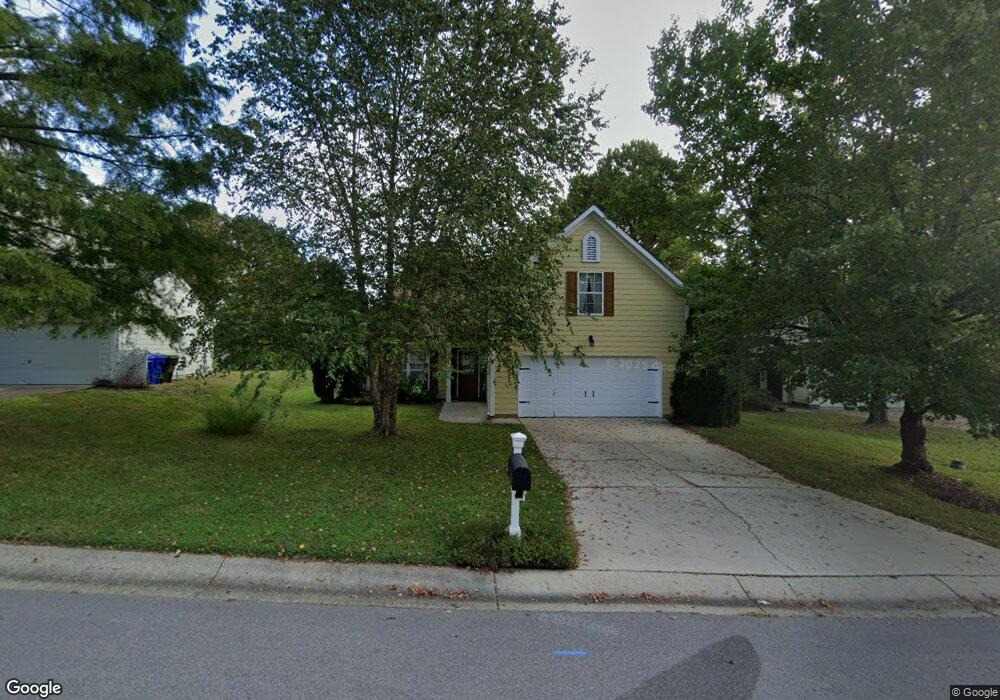
6 Marsh Landing Ct Durham, NC 27703
Eastern Durham NeighborhoodEstimated Value: $397,000 - $436,000
About This Home
This home is located at 6 Marsh Landing Ct, Durham, NC 27703 and is currently estimated at $413,793, approximately $195 per square foot. 6 Marsh Landing Ct is a home located in Durham County with nearby schools including Oak Grove Elementary, John W Neal Middle School, and Southern School of Energy & Sustainability.
Ownership History
We collect this data history from publicly available records. To have your information removed, we recommend requesting removal directly through your county’s website.
Purchase Details
Home Financials for this Owner
Home Financials are based on the most recent Mortgage that was taken out on this home.Home Values in the Area
Average Home Value in this Area
Purchase History
We collect this data history from publicly available records. To have your information removed, we recommend requesting removal directly through your county’s website.
| Date | Buyer | Sale Price | Title Company |
|---|---|---|---|
| $169,500 | -- |
Mortgage History
We collect this data history from publicly available records. To have your information removed, we recommend requesting removal directly through your county’s website.
| Date | Status | Borrower | Loan Amount |
|---|---|---|---|
| Open | $148,000 | ||
| Closed | $40,000 | ||
| Closed | $152,800 | ||
| Closed | $160,750 |
Tax History
We collect this data history from publicly available records. To have your information removed, we recommend requesting removal directly through your county’s website.
| Year | Tax Paid | Tax Assessment Tax Assessment Total Assessment is a certain percentage of the fair market value that is determined by local assessors to be the total taxable value of land and additions on the property. | Land | Improvement |
|---|---|---|---|---|
| 2025 | $3,966 | $400,114 | $66,869 | $333,245 |
| 2024 | $3,306 | $237,020 | $43,773 | $193,247 |
| 2023 | $3,105 | $237,020 | $43,773 | $193,247 |
| 2022 | $3,034 | $237,020 | $43,773 | $193,247 |
| 2021 | $3,019 | $237,020 | $43,773 | $193,247 |
| 2020 | $2,948 | $237,020 | $43,773 | $193,247 |
| 2019 | $2,948 | $237,020 | $43,773 | $193,247 |
| 2018 | $2,779 | $204,847 | $42,152 | $162,695 |
| 2017 | $2,758 | $204,847 | $42,152 | $162,695 |
| 2016 | $2,665 | $204,847 | $42,152 | $162,695 |
| 2015 | $2,944 | $212,700 | $36,551 | $176,149 |
| 2014 | $2,944 | $212,700 | $36,551 | $176,149 |
Map
- 604 Bellmeade Bay Dr
- 1021 Gunston Ln
- 2 Afton Place
- 2005 Slading Trail
- 2007 Slading Trail
- 2009 Slading Trail
- 2003 Slading Trail
- 2011 Slading Trail
- 715 Painted Daisy Ln
- 322 S Mineral Springs Rd
- 711 Painted Daisy Ln
- 4121 Grove Ridge Dr
- 2 Waterview Ct
- 1101 Yellow Leaf Ln
- 1011 Yellow Leaf Ln
- 1009 Yellow Leaf Ln
- 1009 Oak Leaf Ln
- 3 Mooring Ct
- 110 Kindlewood Dr
- 3622 Gibson Rd
- 8 Marsh Landing Ct
- 10 Marsh Landing Ct
- 4 Marsh Landing Ct
- 12 Marsh Landing Ct
- 2 Marsh Landing Ct
- 11 Marsh Landing Ct
- 809 Southshore Pkwy
- 807 Southshore Pkwy
- 5 Marsh Landing Ct
- 7 Marsh Landing Ct
- 603 Bellmeade Bay Dr
- 9 Marsh Landing Ct
- 807 Southshore Pkwy
- 503 Bellmeade Bay Dr
- 805 Southshore Pkwy
- 811 Southshore Pkwy
- 605 Bellmeade Bay Dr
- 803 Southshore Pkwy
- SS231 Southshore Pkwy
- SS236 Southshore Pkwy
Ask me questions while you tour the home.