6 Marvin St Providence, RI 02909
West End NeighborhoodEstimated Value: $362,272 - $583,000
About This Home
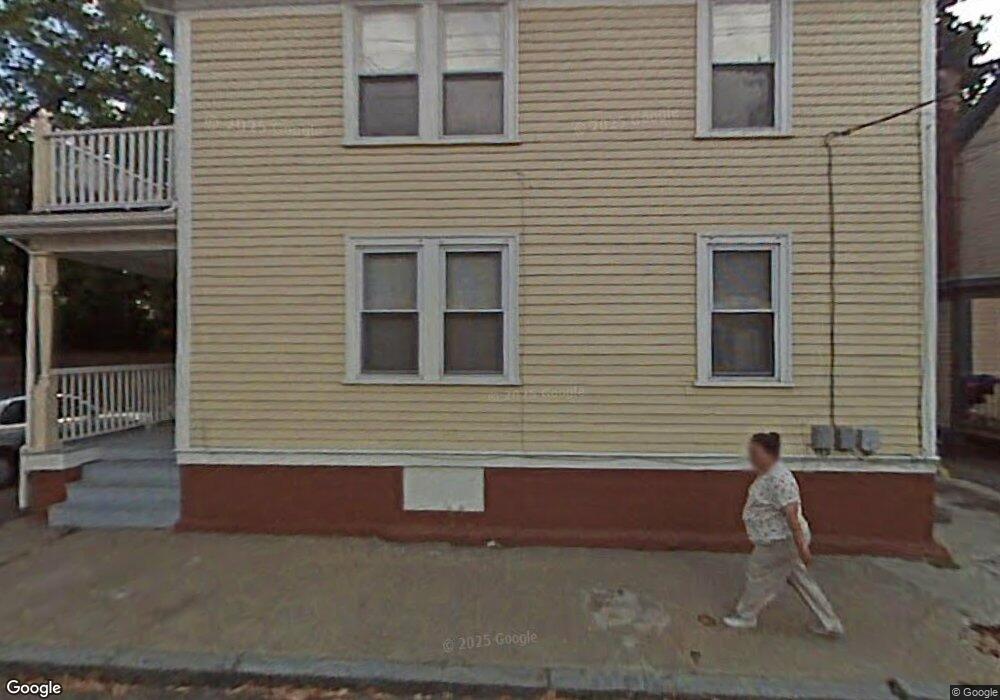
This home is located at 6 Marvin St, Providence, RI 02909 and is currently estimated at $490,818, approximately $235 per square foot. 6 Marvin St is a home located in Providence County with nearby schools including Paul Cuffee Middle School and Holy Ghost School.
Ownership History
We collect this data history from publicly available records. To have your information removed, we recommend requesting removal directly through your county’s website.
Purchase Details
Home Financials for this Owner
Home Financials are based on the most recent Mortgage that was taken out on this home.Purchase Details
Home Financials for this Owner
Home Financials are based on the most recent Mortgage that was taken out on this home.Home Values in the Area
Average Home Value in this Area
Purchase History
We collect this data history from publicly available records. To have your information removed, we recommend requesting removal directly through your county’s website.
| Date | Buyer | Sale Price | Title Company |
|---|---|---|---|
| $160,000 | -- | ||
| $236,000 | -- | ||
| $37,000 | -- |
Mortgage History
We collect this data history from publicly available records. To have your information removed, we recommend requesting removal directly through your county’s website.
| Date | Status | Borrower | Loan Amount |
|---|---|---|---|
| Open | $158,746 | ||
| Previous Owner | $37,219 |
Tax History
We collect this data history from publicly available records. To have your information removed, we recommend requesting removal directly through your county’s website.
| Year | Tax Paid | Tax Assessment Tax Assessment Total Assessment is a certain percentage of the fair market value that is determined by local assessors to be the total taxable value of land and additions on the property. | Land | Improvement |
|---|---|---|---|---|
| 2025 | $2,817 | $373,100 | $105,600 | $267,500 |
| 2024 | $4,666 | $254,300 | $70,400 | $183,900 |
| 2023 | $4,666 | $254,300 | $70,400 | $183,900 |
| 2022 | $4,527 | $254,300 | $70,400 | $183,900 |
| 2021 | $3,124 | $127,200 | $32,800 | $94,400 |
| 2020 | $3,124 | $127,200 | $32,800 | $94,400 |
| 2019 | $3,124 | $127,200 | $32,800 | $94,400 |
| 2018 | $3,247 | $101,600 | $32,500 | $69,100 |
| 2017 | $3,247 | $101,600 | $32,500 | $69,100 |
| 2016 | $3,247 | $101,600 | $32,500 | $69,100 |
| 2015 | $2,959 | $89,400 | $32,500 | $56,900 |
| 2014 | $3,017 | $89,400 | $32,500 | $56,900 |
| 2013 | $3,017 | $89,400 | $32,500 | $56,900 |
Map
- 40 Sycamore St
- 54 Barton St
- 191 Chapin Ave
- 34 Hudson St
- 33 Wood St
- 20 Bainbridge Ave
- 86 Tobey St
- 24 Wood St Unit 2
- 59 Wendell St
- 1403 Westminster St Unit E
- 161 Ford St
- 169 Courtland St Unit 6
- 49 Sorrento St
- 358 Carpenter St Unit 9
- 147 Parade St
- 75 Atwood St
- 102 Superior St
- 30 Division St Unit 76
- 30 Division St Unit 68
- 17 Huldah St
Ask me questions while you tour the home.