Estimated Value: $346,779 - $515,000
Studio
--
Bath
1,246
Sq Ft
$343/Sq Ft
Est. Value
About This Home
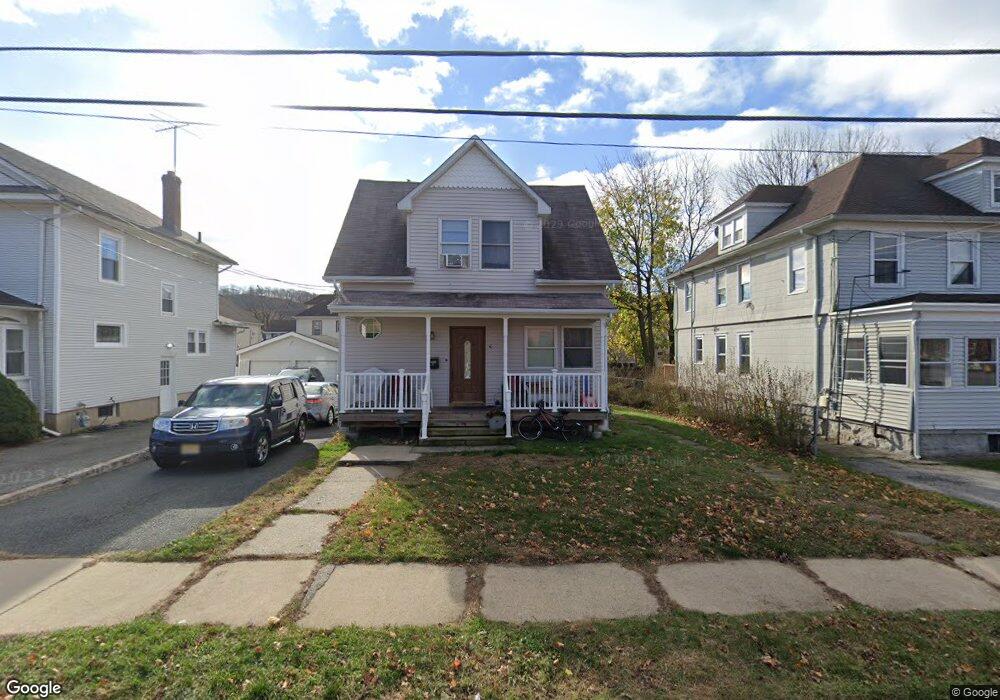
This home is located at 6 Mase Ave, Dover, NJ 07801 and is currently estimated at $426,945, approximately $342 per square foot. 6 Mase Ave is a home located in Morris County with nearby schools including Dover Middle School and Dover High School.
Ownership History
Date
Name
Owned For
Owner Type
Purchase Details
Closed on
Apr 11, 2007
Sold by
Delvalle Carmen
Bought by
Ugalde Pedro
Current Estimated Value
Purchase Details
Closed on
Aug 31, 1998
Sold by
Delvalle Santos and Delvalle Nicasia
Bought by
Delvalle Adelaide
Home Financials for this Owner
Home Financials are based on the most recent Mortgage that was taken out on this home.
Original Mortgage
$103,050
Interest Rate
6.9%
Mortgage Type
FHA
Create a Home Valuation Report for This Property
The Home Valuation Report is an in-depth analysis detailing your home's value as well as a comparison with similar homes in the area
Home Values in the Area
Average Home Value in this Area
Purchase History
| Date | Buyer | Sale Price | Title Company |
|---|---|---|---|
| Ugalde Pedro | $137,500 | First American Title Ins Co | |
| Delvalle Adelaide | $104,000 | Old Republic Title |
Source: Public Records
Mortgage History
| Date | Status | Borrower | Loan Amount |
|---|---|---|---|
| Previous Owner | Delvalle Adelaide | $103,050 |
Source: Public Records
Tax History
| Year | Tax Paid | Tax Assessment Tax Assessment Total Assessment is a certain percentage of the fair market value that is determined by local assessors to be the total taxable value of land and additions on the property. | Land | Improvement |
|---|---|---|---|---|
| 2025 | $5,839 | $178,400 | $72,000 | $106,400 |
| 2024 | $5,632 | $178,400 | $72,000 | $106,400 |
Source: Public Records
Map
Nearby Homes
- 60 Searing St
- 12 Lincoln Ave
- 25 Passaic St
- 301 E McFarlan St -A and B
- 11 Christopher St
- 8 N Salem St
- 38 E Dickerson St
- 113 Pequannock St
- 14 Jessica Ln
- 179 Pequannock St
- 7 Jessica Ln
- 60 Watson Dr
- 5 A&B Dewey St
- 376 E Blackwell St
- 13 James St
- 138 S Salem St
- 142 W Blackwell St
- 42 1st St Ab
- 15 Blakely Ave
- 413 Boulder Ridge Dr Unit 413
Your Personal Tour Guide
Ask me questions while you tour the home.